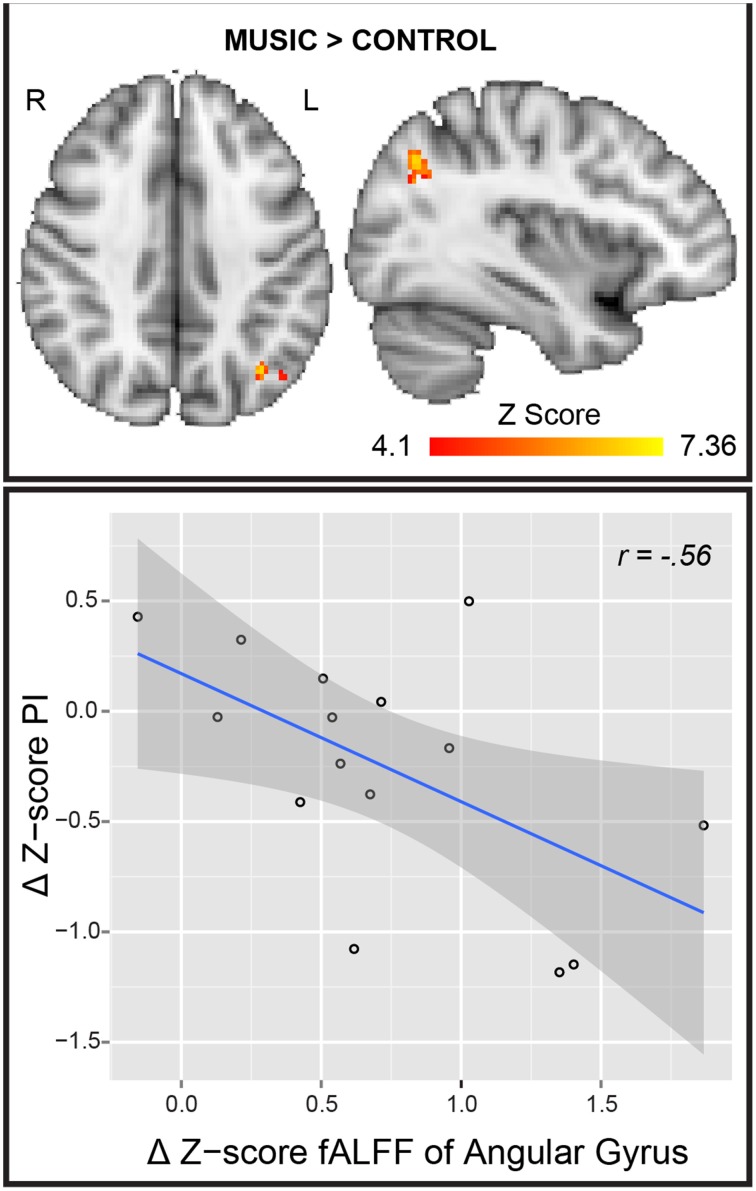
Figure 3.
fALFF Analysis. (Top) Result of the fALFF Mpos > Cpos analysis. R, right; L, left. (Bottom) Scatter plot and regression line of Δ Z-score PI (y axis) and the Δ Z-score of the angular gyrus cluster. PI, pain intensity; r, Pearson's correlation coefficient; Mpos, post-Music; Cpos, post-Control; Δ, Mpos–Cpos.

