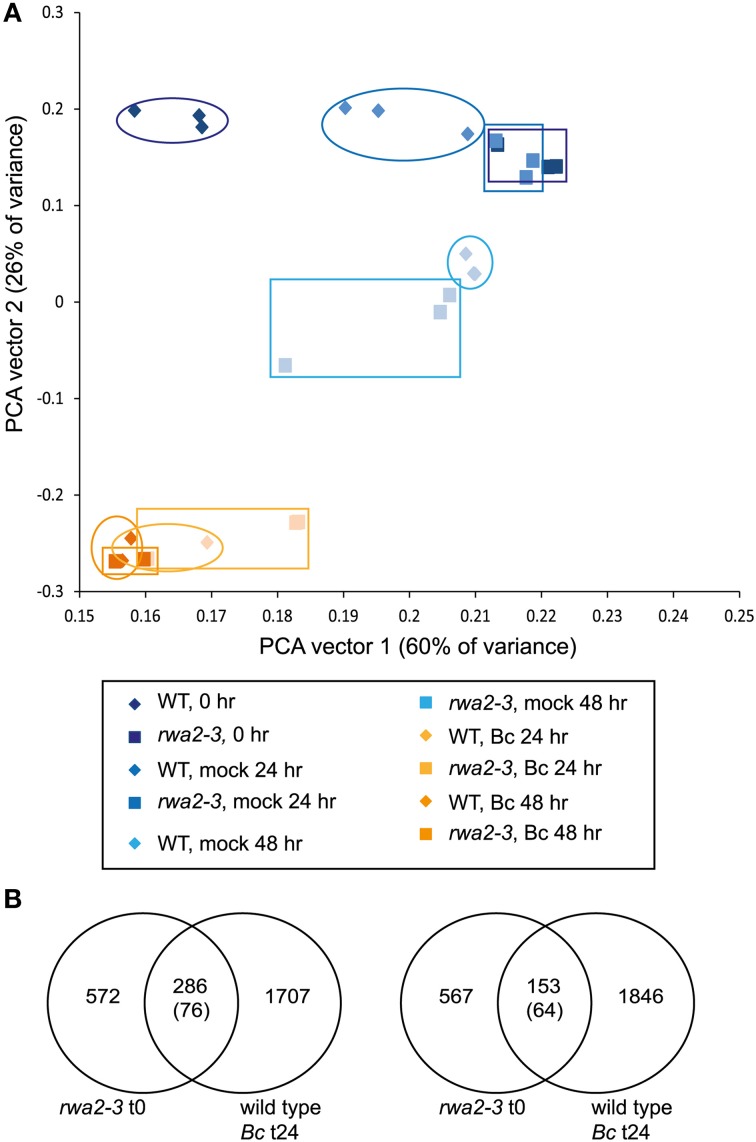
Figure 7.
Global transcript analysis. (A) Shown is a principal component analysis of the entire dataset with the individual samples plotted. Wild type samples are shown as diamonds and rwa2 samples are shown as squares with the blue to orange transition showing the time course of the experiment. The first two PCA vectors are utilized that explain 86% of the total variance. (B) VENN diagrams showing the overlap of genes differentially expressed (left side: upregulated genes, right side repressed genes) in rwa2 control vs. wild type control, and wild type infected with B. cinerea vs. wild type mock across the time points. The genes that are differentially expressed in rwa2 control vs. the corresponding wild-type samples have a high overlap with the expression profile of genes in wild type infected with B. cinerea. The numbers in brackets represent the overlap expected by chance. The overlaps are highly significant both for induced (P < 0.001) and for repressed genes (P < 0.001) as determined by χ2-test.

