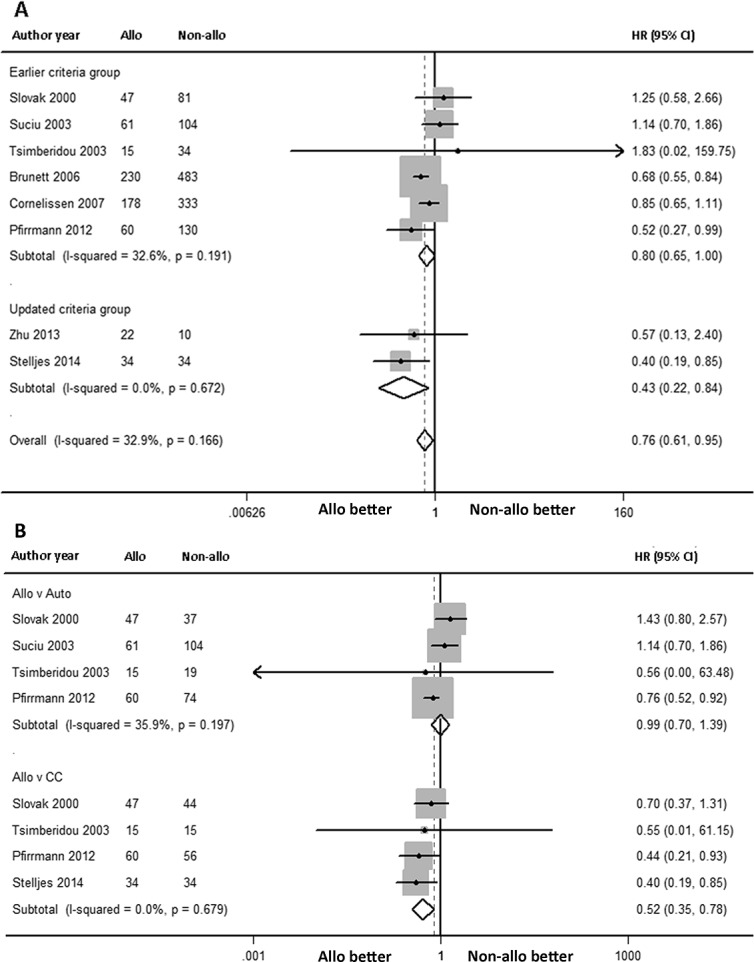
Fig 3. Forest plot of the OS benefit of alloHSCT in intermediate-risk AML-CR1.

(A) Forest plot of the overall OS benefit and the subgroup OS benefit (earlier criteria group versus updated criteria group) in intermediate-risk AML-CR1. (B) Forest plot of the subgroup OS benefit (alloHSCT versus autoHSCT, alloHSCT versus chemotherapy) in intermediate-risk AML-CR1. The study of Tsimberidou 2003 has a wide 95% CI, we speculated it may influence by the small size of number.
