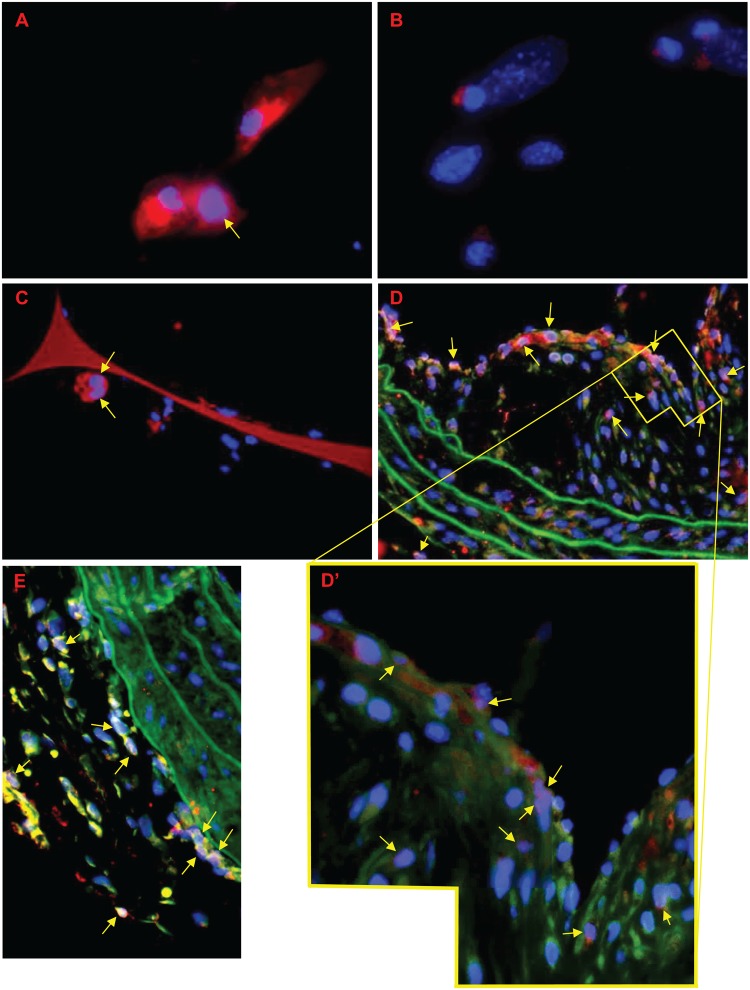
Fig 7. cFOS in sponge and artery macrophages from mice.
cFOS is present in the cytoplasm (red) or nucleus (pink, arrows) in isolated macrophages from A) mice fed a high-fat diet (FCMs) or B) a normal diet (NFMs). cFOS was also observed in the cytoplasm (red, orange, yellow) and/or nucleus (pink, arrows) of cells in sections from C) a subcutaneous sponge granuloma or D, E) a brachiocephalic artery from a fat-fed ApoE null mouse. D’) higher magnification of plaque in D. Blue = nuclei (DAPI), green = autofluorescence. Magnification x 400 A-E, x 1000 D’. See Fig 5C and 5D for negative control staining.

