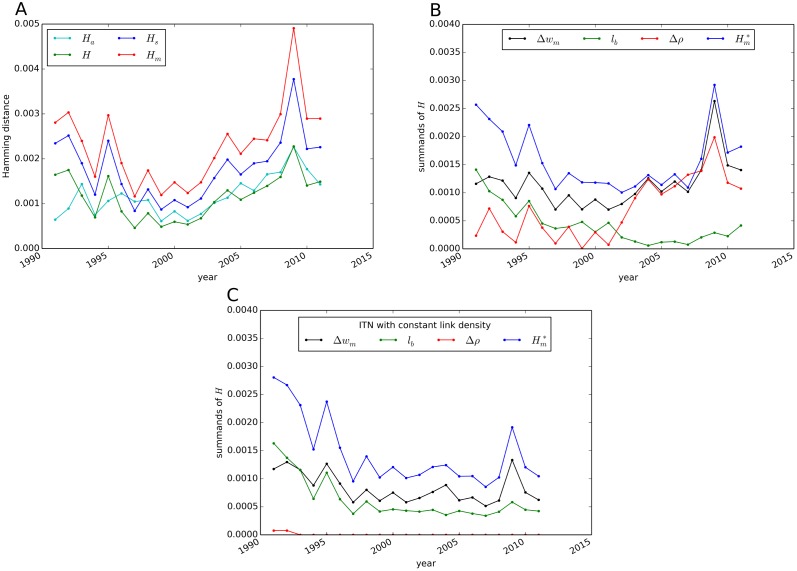
Fig 11. Hamming distance between the ITN in the current and the respective preceding year for 1991–2011.
Various generalizations of H to weighted networks are compared (A). The contributions as defined in Eq (16) are illustrated for the ITN constructed with thresholding (B) and constant link density (C).

