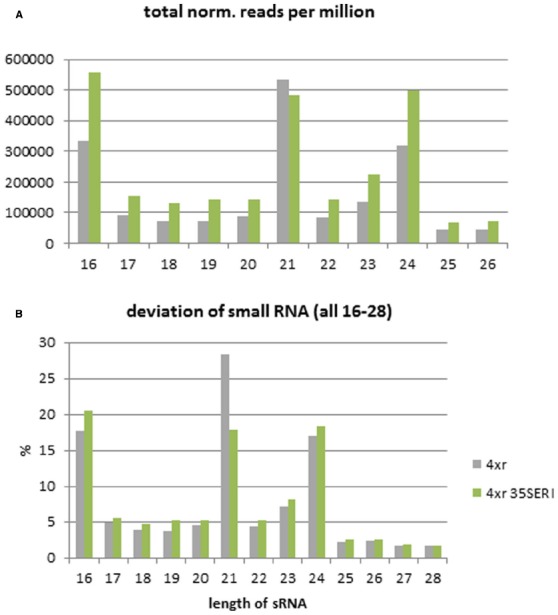
FIGURE 3.

Size distribution of small RNAs. (A) Read count obtained by high throughput sequencing normalized to reads per million. (B) Population of small RNAs separated in size classes given in percent of total estimated reads from Col-0 and 35S:AtERI in 4xGUS reporter background. 4xr (gray): Col-0 with 4xGUS reporter, 4xr 35SERI (green): 35S:AtERI with 4xGUS reporter.
