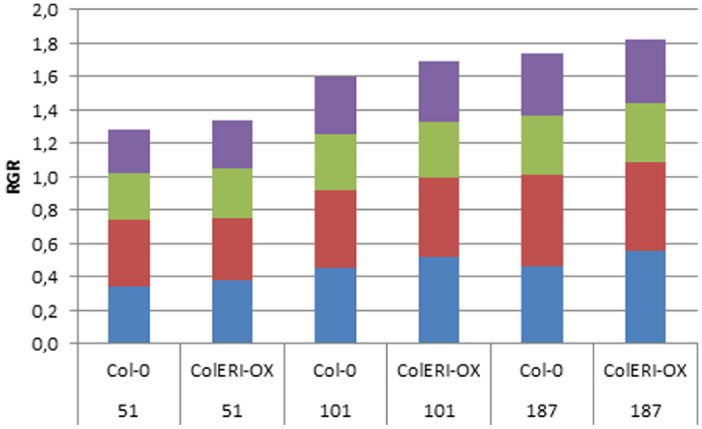
FIGURE 5.

Relative growth rates in Col-0 and 35S:AtERI at different light intensities. RGRs were estimated from seed (0 DAS) and leaf area (6, 8, 14, 16 DAS) and are given in mm2 d–1: blue, RGR0-6 (between 0 and 6 DAS); red, RGR6-8; green, RGR8-14; purple, RGR14-16. 51, 101, 187 indicate the light intensities (μmol m–2s–1) the plants were grown in.
