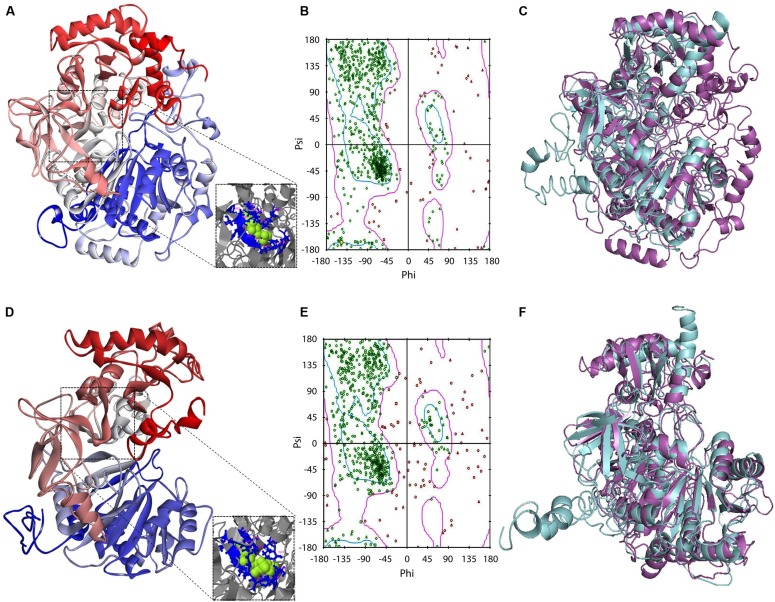
FIGURE 3.
Protein modeling features of GiACS1 and GiACS2. The protein folding models for GiACS1 (A) and GiACS2 (D) were retrieved using yeast ACS (PDB ID: 1RY2) as a template. Protein models are colored from N-terminus (blue) to C-terminus (red) and oriented in relation to the AMP/ATP heterogen (insets). The Ramachandran plots calculated for GiACS1 (B) and GiACS2 (E) display glycine (triangles), proline (squares), and non-glycine non-proline (circles) residues. The structural alignments of GiACS1 (magenta) with HsACS5CRAc (cyan) (C) and 541 GiACS2 (magenta) with HsACS5b (cyan) (F) display folding differences between giardial and human counterparts.

