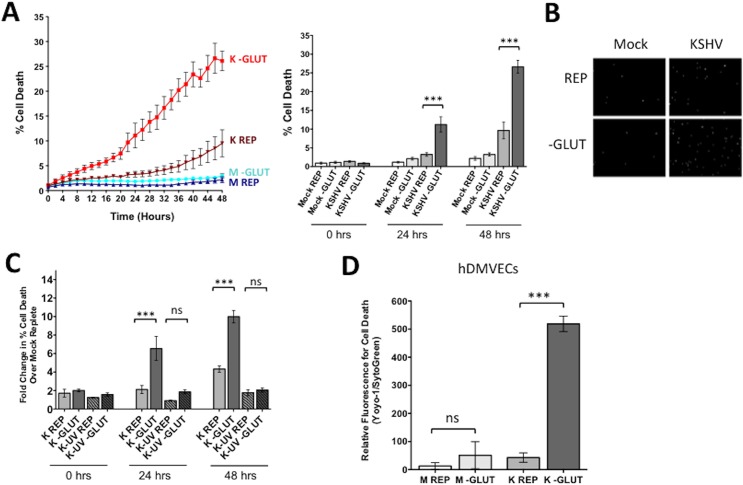
Fig 2. Glutamine metabolism is required for the survival of latently infected endothelial cells.
(A) At 20 hpi, mock- or KSHV-infected TIME cells were re-seeded into 24-well plates in triplicate. Cells were treated with replete (REP) or glutamine-free (-GLUT) media containing the fluorescent dye YOYO-1 to identify dead cells or SytoGreen24 to identify total cell number. Cells were imaged every 2 hours for 48 hours on the Essen BioScience IncuCyte. The line graph displays percent cell death (Average YOYO-1 positive cells/Average SytoGreen positive cells) for every time point over 48 hours of treatment, while the bar graph shows the percent cell death at t = 0, 24, and 48 hours post treatment. Data shown represents the average of three independent experiments. Error bars are SEM, and a p-value < 0.0001 is represented by three asterisks. (B) IncuCyte microscopy images identifying dead cell nuclei (YOYO-1) for Mock- and KSHV-infected cells in replete or glutamine-free media at 48 hours post treatment (72 hpi). Essen software was used to identify cell nuclei by size and fluorescent intensity, with background subtracted. YOYO-1 positive nuclei are in white. (C) TIME cells were Mock-, KSHV-, or KSHV-UV (UV-irradiated) infected and prepared as described in panel A. Cells were imaged every 2 hours for 48 hours on the Essen BioScience IncuCyte. Fold increase in cell death of each sample over Mock replete at t = 0 is shown. Error bars represent SEM, p-value < 0.0001 and “ns” is shown where the averages are not significantly different. (D) Primary hDMVECs were re-seeded into 24-well plates at 48 or 72 hpi and were treated with Replete (4 mM glutamine) or glutamine-free media and 48 hours post treatment were scanned on the Typhoon 9400 variable mode imager (GE Healthcare) and analyzed with ImageJ software for relative fluorescence. Data shown represent the average of three independent experiments. Error bars are SEM. A p-value < 0.0001 is represented by three asterisks and “ns” is shown where the averages are not significantly different.

