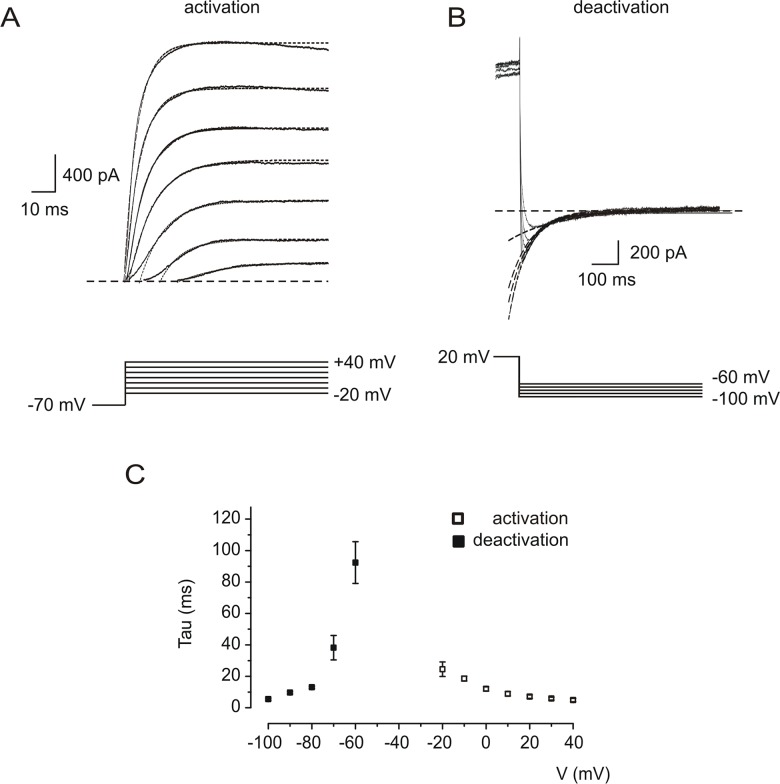
Fig 2. Voltage-dependent activation and deactivation of Ics.
A: Response of a representative neuron to depolarizing voltage steps from a holding potential of -70 mV. Application of voltage steps (lower panel) resulted in outward currents (upper panel, solid lines) which were fitted mono-exponentially (dashed lines). B: Hyperpolarizing steps (lower panel) from +20 mV, resulted in inward tail currents (upper panel, solid lines). Deactivation of Ics was voltage-dependent and was also fitted with single exponentials (dashed lines). C: Time constants of activation (empty squares) and deactivation (filled squares) as a function of membrane voltage (n = 5 neurons).

