
Figure 3.
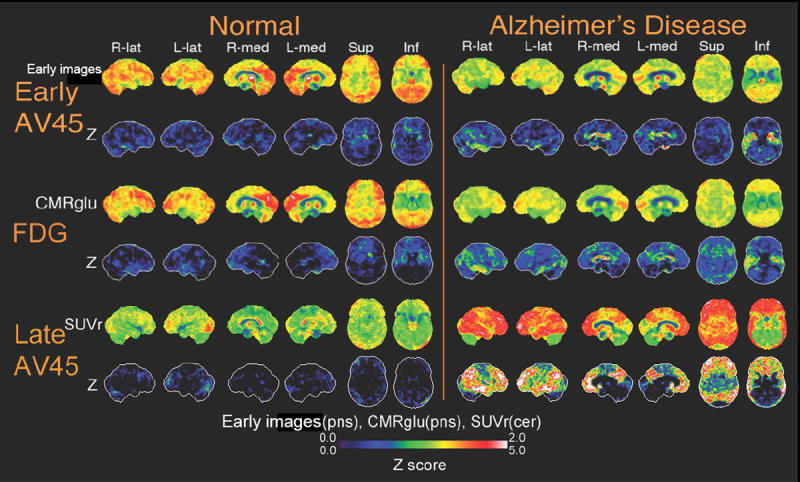
Neurostat SSP surface maps of uptake and Z scores for early phase florbetapir (0-20 min post-injection), FDG, and late phase florbetapir images (50-70 min post-injection) are shown comparing one normal subject and one AD subject. Early florbetapir cerebral blood flow rate is normalized to the pons value. FDG glucose metabolic rate is normalized to pons. Late florbetapir uptake value is normalized to the cerebellum. The normal subject shows few deficits in cerebral blood flow, metabolism and amyloid binding. The AD subject shows similar regions for deficits in cerebral blood flow and metabolism. The AD subject also shows significant accumulation of amyloid.