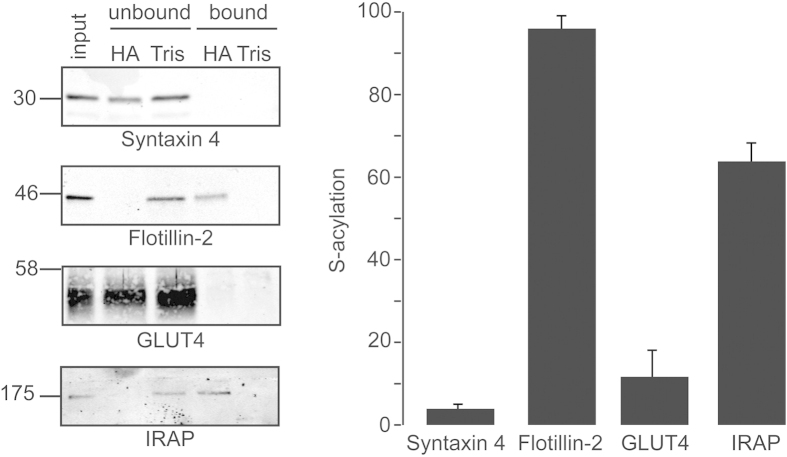
Figure 1. Semi-quantitative analysis of IRAP S-acylation in 3T3-L1 adipocytes.
On day 9 following initiation of the cell differentiation protocol, 3T3-L1 cells were incubated overnight in media containing 5.55 mM D-glucose. Cell membranes were then recovered by centrifugation and incubated with MMTS (1.5% v/v), and then with either 0.5 M hydroxylamine (HA) or 0.5 M Tris together with free thiol group binding beads. Left panel: Recovered fractions were analysed by immunoblotting with the indicated antibodies. Position of molecular weight standards are shown on the left. Equivalent amounts of unbound and bound fractions were loaded, whereas the input sample was loaded at half this amount. Right panel: Quantification of S-acylation levels of proteins was determined using densitometry of immunoblots shown in panel A (n = 3).

