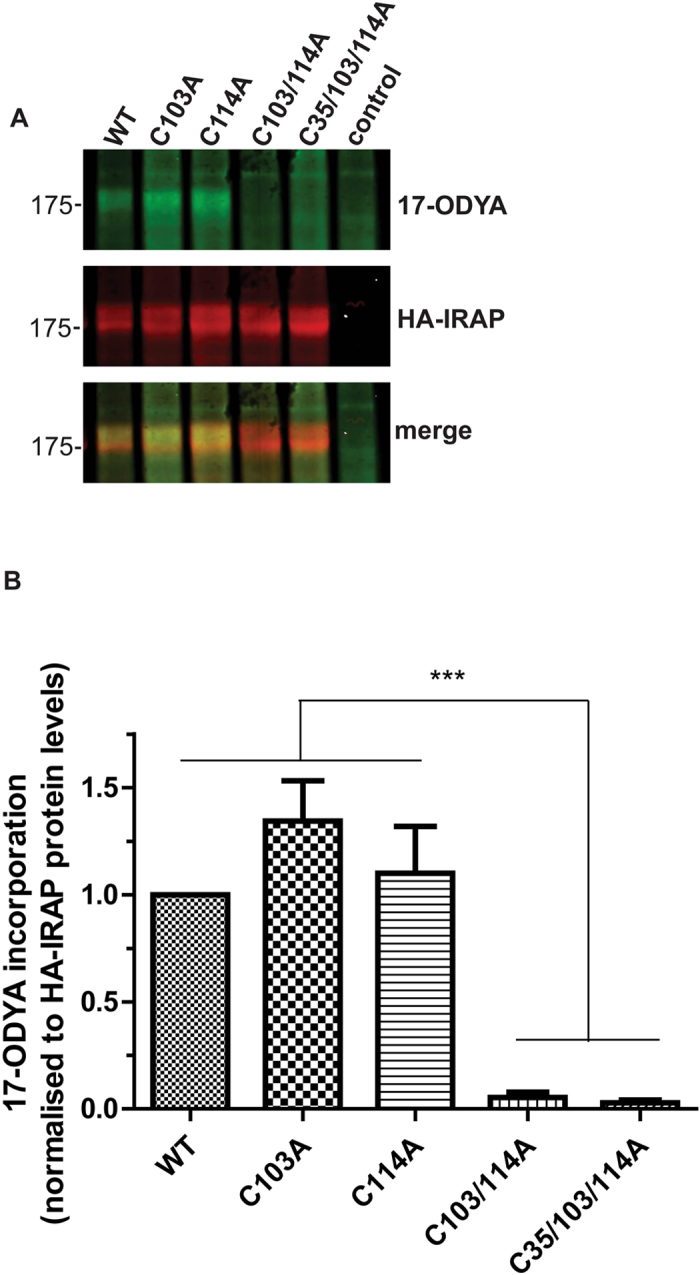
Figure 3. Mapping of S-acylation sites in IRAP.

HEK293T cells were transfected with plasmids encoding the indicated HA-tagged IRAP constructs for 24 h. Cells were then metabolically labelled with 15 μM 17-ODYA and incorporation of 17-ODYA into IRAP was detected by reaction with IRDye 800CW azide. Samples were subjected to SDS-PAGE and analysed by immunoblotting. Anti-HA antibody binding and IRDye were visualised using a LICOR Odyssey infrared imaging system. A Representative images showing 17-ODYA incorporation into wild-type and mutant IRAP (top panel), HA immunoreactivity (middle panel) and a merge (bottom panel). Position of molecular weight markers are shown on the left. B Quantification of 17-ODYA incorporation into IRAP constructs. Quantified values of the 17ODYA signal from IRAP constructs were normalised to protein expression level. The calculated value of 17-ODYA incorporation into wild type IRAP was set to 1 and all mutants were expressed relative to this. One way ANOVA followed by Tukey’s multiple comparison test was applied for statistical analysis. ***P ≤ 0.001 (n = 5).
