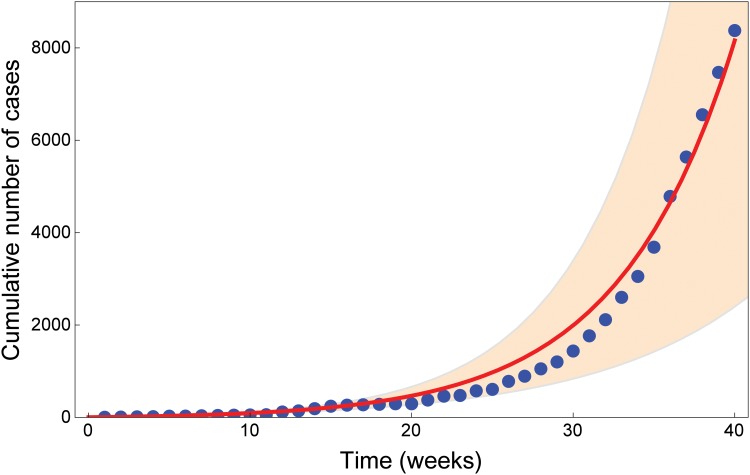
Fig 2. Data fit for Ebola cases in West Africa from week 1 to week 40.
The blue dots show the cumulative number of cases reported by [23] from week 1 (ending 3 Jan 2014) to week 40 (ending 3 Oct 2014). The cumulative number of cases reported is the sum of confirmed, suspected and probable cases. The red curve shows the fit with parameter values in Table 1. The orange region shows the total number of cases predicted by the model (95% CI).

