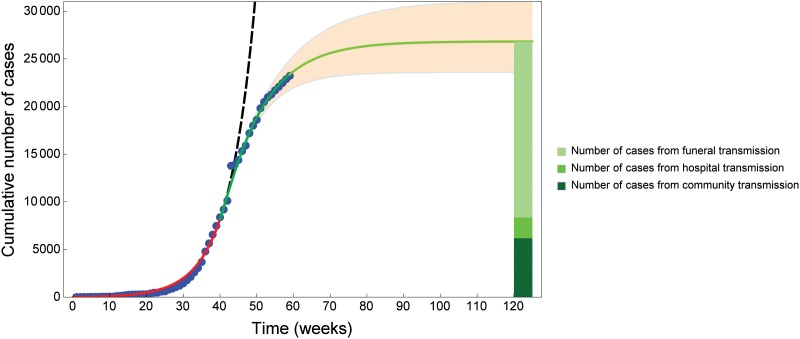
Fig 4. Data fit for Ebola cases in West Africa from week 1 to week 60 and prediction until week 120.
The blue dots show the cumulative number of cases reported by [7, 23, 24]. The cumulative number of cases reported in Fig 2 is the sum of confirmed, suspected and probable cases. The red curve shows the fit obtained with parameter values in Table 1. At week 40 (ending 3 Oct 2014) intervention strategies are introduced. The green curve shows the model fit from week 40 to week 59 (ending 13 Feb 2015), with parameter values in Table 2. The light green curve shows model prediction until week 120 (ending 15 April 2016). The orange region shows the model-predicted total number of cases (95% CI) from the introduction of intervention strategies. The green charts on the right shows which proportion of the estimated cases at week 120 are due to contacts in the community (23%, 6191 out of 26809 cases), contacts in the hospitals (8%, 2173 out of 26809 cases) and contacts at funerals (69%, 18445 out of 26809 cases). If intervention strategies are not introduced at week 40 (black dashed curve), the numerical solution curve deviates from the real data considerably.

