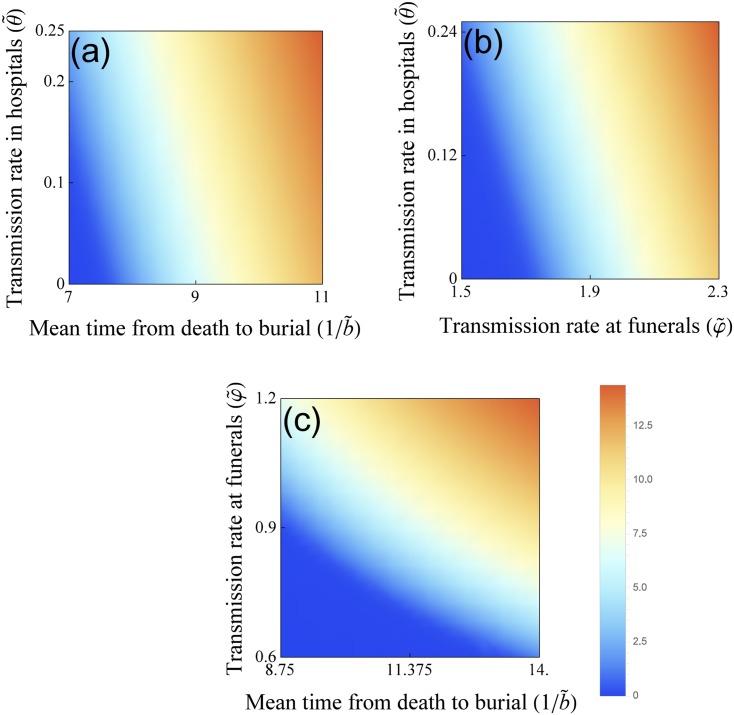
Fig 6. The effects of intervention on the cumulative number of cases.
Sensitivity analysis of the total number of cases during the course of the epidemic. The key intervention parameters, namely, the transmission rate at funerals (φ), the transmission rate in hospitals (θ) and the time from death to burial (1/b) help to control the attack rate of the epidemic. Blue area corresponds to lower cumulative number of cases, the orange area corresponds to higher cumulative number of cases.

