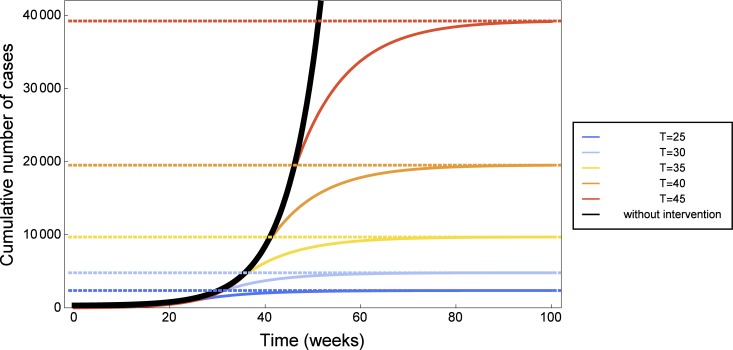
Fig 7. The importance of timely intervention in 2014 Ebola outbreak.
Predicted number of cumulative cases: numerical simulations of the mathematical model (solid lines) and values estimated by the final size formula (2) (dashed lines). The later intervention occurs, the higher the number of Ebola cases. Simulations were done for hypothetical and immediately effective intervention at week 25 (blue), week 30 (light blue), week 35 (yellow), week 40 (orange), week 45 (red). If no intervention strategies are introduced (black curve), the number of Ebola cases grows exponentially.

