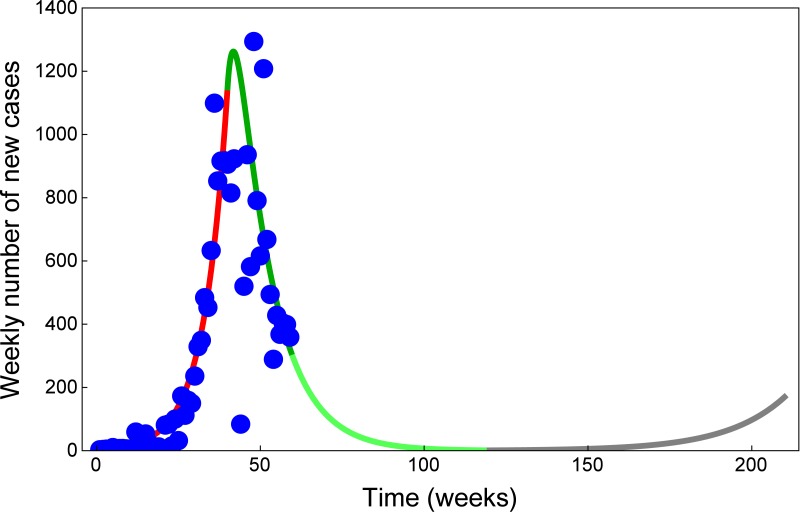
Fig 8. A new Ebola outbreak is possible if control is relaxed.
Model fit for the number of new weekly reported cases, corresponding to the cumulative cases in Fig 4. The blue dots show new weekly cases reported by [7, 23, 24]. The red curve shows the fit obtained with parameter values in Table 1 up to week 40 (ending 3 Oct 2014). The dark green curve shows the model fit from the introduction of control measures at week 40 to week 59 (ending 13 Feb 2015), with parameter values in Table 2. The light green curve shows model prediction until week 200 (ending 27 October 2017). The gray curve shows the model prediction assuming that, at week 120 (ending 15 April 2016), intervention strategies are relaxed to the following values: , , , and .

