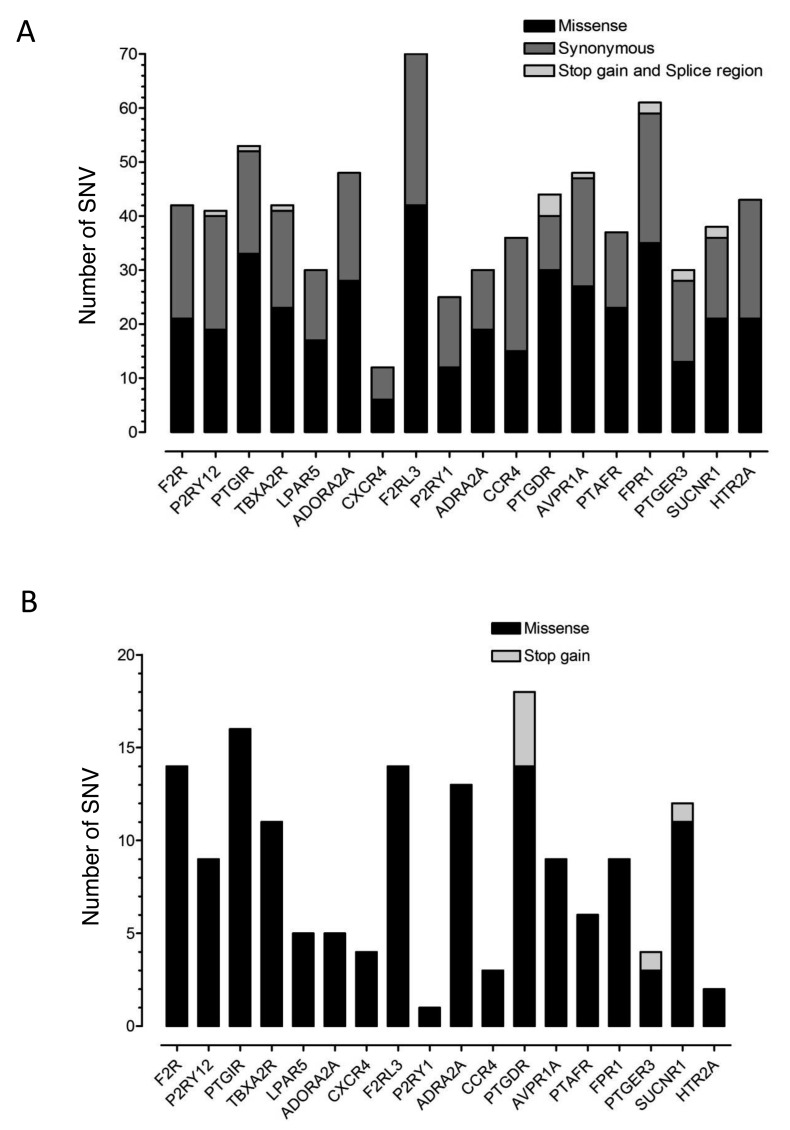
Figure 1:
Distribution of SNVs in the target regions of 18 platelet GPCR genes in the ESP and 1,000 genomes datasets. A) The total number of unique SNVs in each GPCR gene found in the population datasets, subdivided according to whether missense, synonymous or stop-gain/splice region. B) The total number of unique SNVs in the population datasets that were classified as potentially damaging, subdivided according to whether missense or stop-gain.

