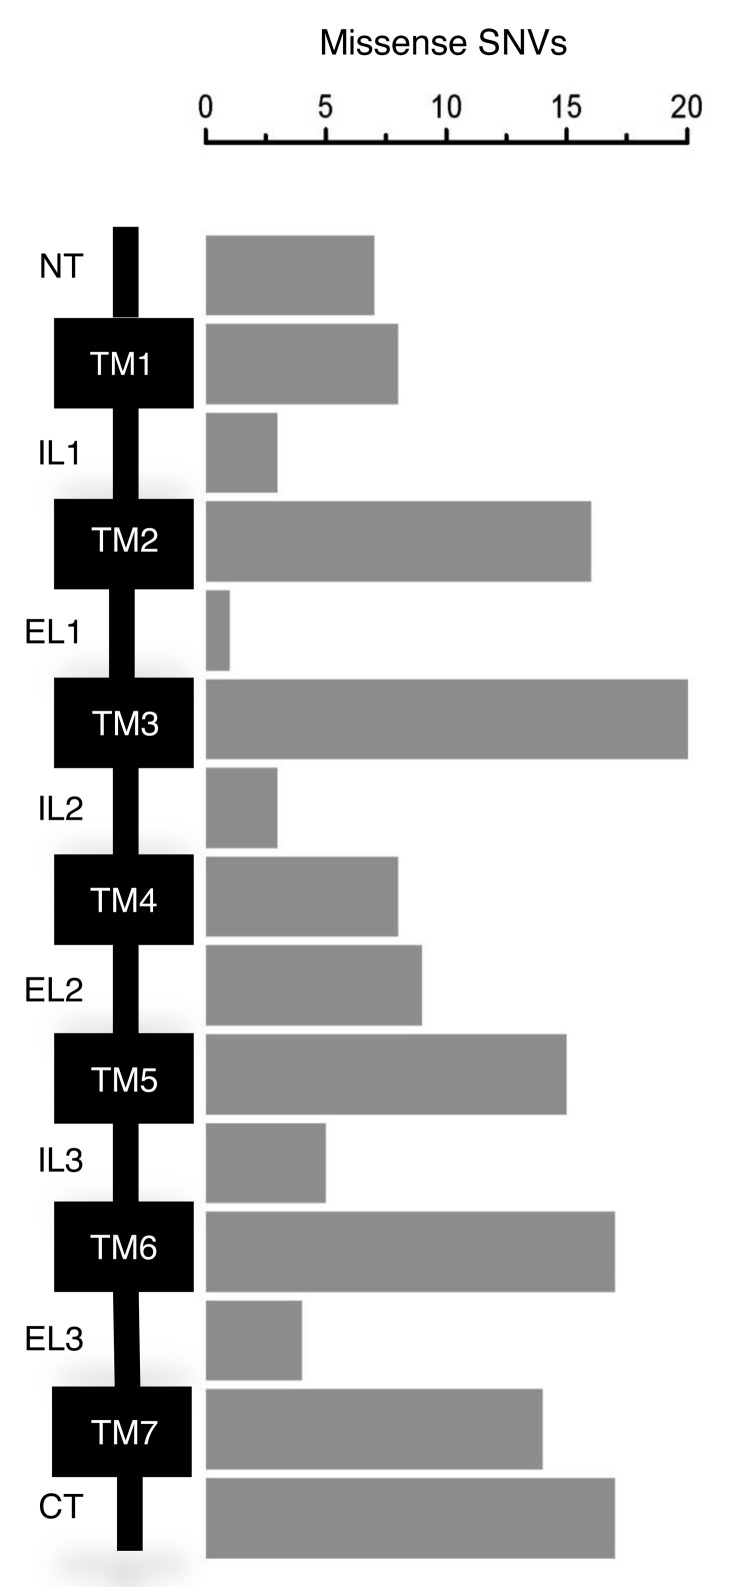
Figure 2:
Distribution of potentially damaging missense SNVs across GPCR domains. Schematic of a prototypical Class A GPCR showing the N-terminal extracellular region (NT), the transmembrane helices (TM1–7), the intracellular (IL) and extracellular (EL) loops, and the C-terminal intracellular region (CT). The number of missense SNVs in the population databases classified as potentially damaging within these regions are represented in the bar chart.

