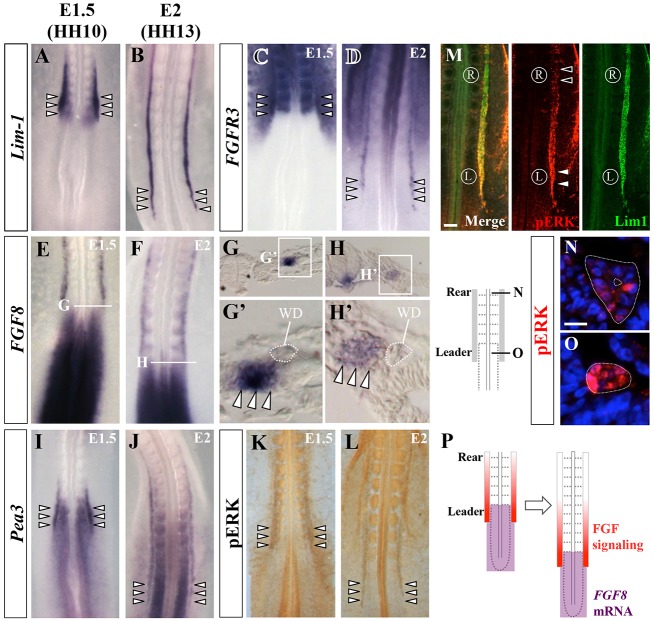
Fig. 3.
Expression patterns of FGF8, FGFR3 and PEA3, and ERK1/2 activity in WD. (A-J) In situ hybridization to show expression of LIM1 (A,B; a marker for WD), FGFR3 (C,D), FGF8 (E-H′) and PEA3 (I,J) mRNA in E1.5/HH10 and E2/HH13 embryos. Arrowheads (A-D,I,J) indicate leader cells. The anterior border of the FGF8-expressing area, including L-IMM and PSM, was juxtaposed to the leader cells with a slight overlap (G′,H′, arrowheads). (K,L) Whole-mount immunostaining for diphosphorylated ERK1/2 (pERK) in E1.5/HH10 (K) and E2/HH13 (L) embryos. Arrowheads indicate leader cells. (M) E2/HH13 embryo stained with antibodies for pERK (red) and LIM1 protein (green). Signals for pERK were more intense in leader cells (white arrowheads) than in rear cells (black arrowheads). (N,O) Transverse sections of E2/HH13 embryos immunostained for pERK showing leader cells (O) and rear cells (N). (P) Diagram illustrating the relative positions of FGF signal activation in WD (red) and caudal regression of the FGF8-expressing area (purple). Scale bars: 100 μm in M; 20 μm in N.

