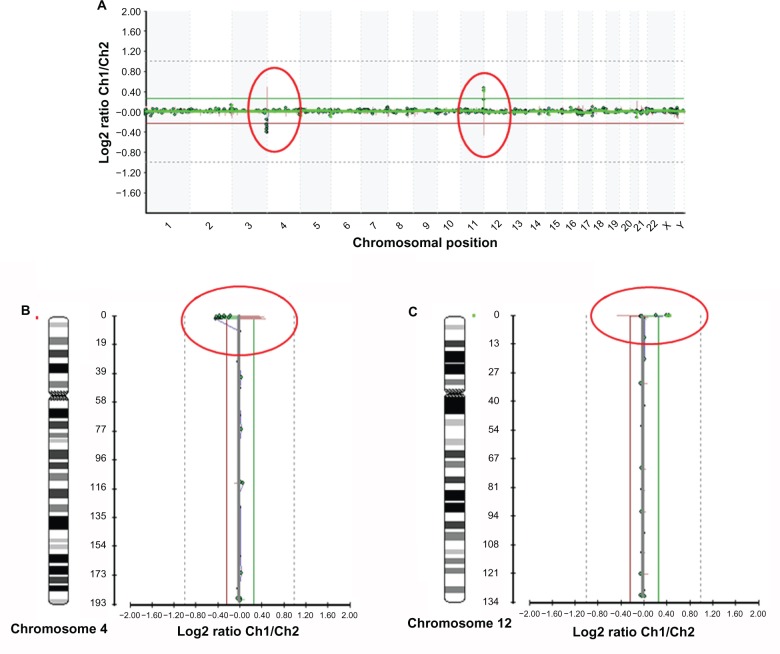
Figure 2.
A. Microarray profile of Wolf-Hirschhorn syndrome (del 4p16.3) in a patient also carrying dup12p13.33, identified by microarray-based comparative genomic hybridization (array CGH) using GOLD Chip. Each clone represented on the array is arranged along the x-axis according to its location on the chromosome with the most distal/telomeric p-arm clones on the left and the most distal/telomeric q-arm clones on the right. The green lines represent the log2 ratios from the first experiment (patient Cy3/control Cy5), whereas the red plots represent the log2 ratios obtained from the second experiment in which the dyes have been reversed (patient Cy5/control Cy3). B and C. Microarray profiles of chromosomes 4 (B) and 12 (C). The green line represents the patient-to-control fluorescence intensity ratios (gain of DNA); the red line represents dye-reversed control-to-patient fluorescence ratios (loss of DNA). Deletion in 4p16.3 is represented from BAC clones C4P-023, C4P-022, C4P-021, C4P-020, C4P-018, C4P-016, C4P-014, C4P-013, C4P-011, C4P-010, C4P-008; duplication in 12p13.33 is represented from BAC clones C12P-010 and C12P-009.

