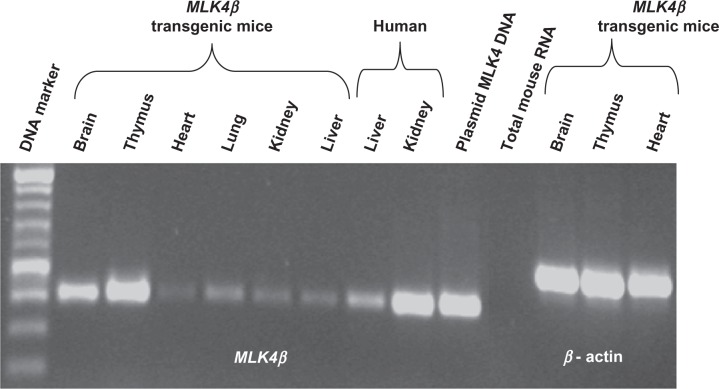
Figure 7.
RT-PCR analysis of MLK4β expression in the different transgenic mouse tissues. M—DNA marker; 1–6—transgenic mouse tissues (1 = brain, 2 = thymus, 3 = heart, 4 = lung, 5 = kidney, 6 = liver); 7—human liver; 8—human kidney; 9—plasmid MLK4 DNA (positive control), 10—total mouse RNA (negative control), 11–13—actin expression control for the transgenic mouse tissues (11 = brain, 12 = thymus, 13 = heart).

