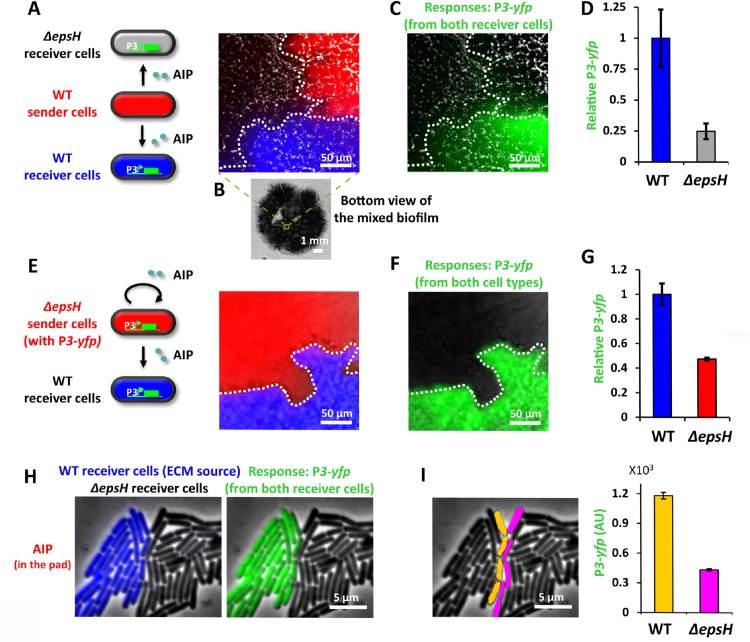
Fig 3. ECM enhances the response of producer cells to QS signal in biofilms.
(A) A local region in a mixed biofilm where clusters of WT Sender cells (red), WT Receiver cells (blue) and ΔepsH Receiver cells (grey) merge. Sender cells are marked by PrpsD-mCherry and WT Receiver cells are marked by PrpsD-cfp, where PrpsD is a constitutive promoter. In this experiment, WT Sender cells (red) secrete AIP that diffuses to nearby WT (blue) and ΔepsH (grey) Receiver cells. Both Receiver cells respond to AIP by expressing YFP. (B) Bottom view of the mixed biofilm. (C) P3-yfp overlaid on bright field image showing the same biofilm region as in A. (D) Relative mean P3-yfp intensity of WT Receiver cells and ΔepsH Receiver cells (mean ± SEM, n = 3, p<0.09). (E) A local region in a mixed biofilm where clusters of ΔepsH Sender cells (with P3-yfp, red) and WT Receiver cells (false colored as blue) merge. ΔepsH Sender cells (with P3-yfp) are marked by PrpsD-cfp. In this experiment, ΔepsH Sender cells (red) secrete AIP which induces a response in the ΔepsH Sender cells (red) themselves. Meanwhile some AIP will diffuse to nearby WT Receiver cells and trigger a response. (F) P3-yfp overlaid on bright field image showing the same biofilm region as in E. (G) Relative mean P3-yfp intensity of WT Receiver cells and ΔepsH Sender cells (with P3-yfp) (mean ± SEM, n = 3, p<0.05). (H) A snapshot of WT (blue) and ΔepsH (grey) Receiver cells growing near each other on an MSgg agar pad containing 100nM AIP. WT Receiver cells are marked by PrpsD-cfp. The response, P3-yfp, is shown in green on the right panel. (I) Response of WT (false colored as orange) and ΔepsH Receiver cells (false colored as magenta) on the interface where these two strains merge (mean ± SEM, n = 39 cells, p<0.0001).

