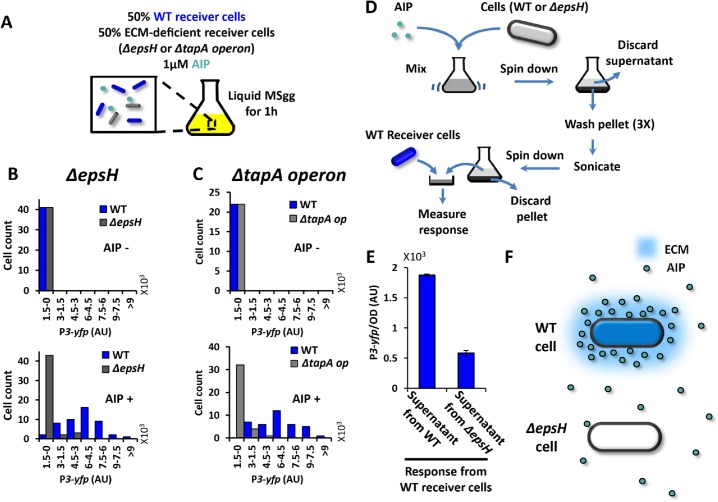
Fig 4. ECM retains AIP around ECM producer cells and enhances their response to AIP even in liquid culture.
(A) Illustration of experimental setup for B-C. ECM-deficient Receiver cells (ΔepsH or ΔtapA operon) and WT Receiver cells (PrpsD-cfp, blue) are growing together in liquid culture containing 0 or 1 μM AIP for 1h before the response (P3-yfp) is quantified. (B) Histograms of P3-yfp fluorescence intensity from ΔepsH Receiver cells and WT Receiver cells (n = 41 cells for the upper panel and n = 48 cells for the bottom panel). The expression of P3-yfp was measured for individual cells from microscopic snapshots. (C) Histograms of P3-yfp fluorescence intensity from ΔtapA operon Receiver cells and WT Receiver cells (n = 22 cells for the upper panel and n = 40 cells for the bottom panel). The expression of P3-yfp was measured for individual cells from microscopic snapshots. (D) Scheme of the experimental setup in E. (E) Response of WT Receiver cells to AIP extracted from WT cells or ΔepsH cells (mean ± SEM, n = 4, p<0.0001). (F) A diagram illustrates that WT cells concentrate AIP in their vicinity, while ΔepsH cells do not.

