
Figure 3.
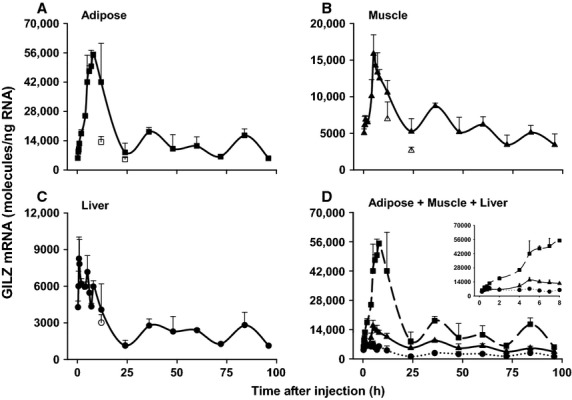
Dynamics of GILZ mRNA regulation by acute MPL bolus in rat adipose (A), muscle (B), and liver (C). Panel D provides direct comparison of GILZ mRNA expression profiles in all three tissues. The inset in Panel (D) presents an expanded version of the data through 8 h. Closed boxes, triangles, and circles are means of treated animals in adipose, muscle, and liver; open boxes, triangles, and circles are means of light/dark control animals in adipose, muscle, and liver. Error bars represent one standard deviation (n = 3). Note: time in the plot represents time following MPL dosing at 2 h after lights on.