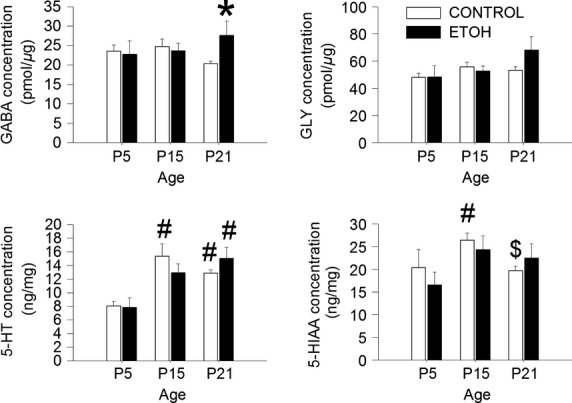
Figure 4.

Concentrations of GABA, GLY, 5-HT, and 5-HIAA from the brainstems of CONTROL (n = 12) and ETOH (n = 6) groups at P5, P15, and P21.*significant difference from CONTROL (P < 0.05), #Significant difference from P5 (P < 0.01), $Significant difference from P15 (P < 0.05). All values are expressed as mean (SEM).
