
Figure 2.
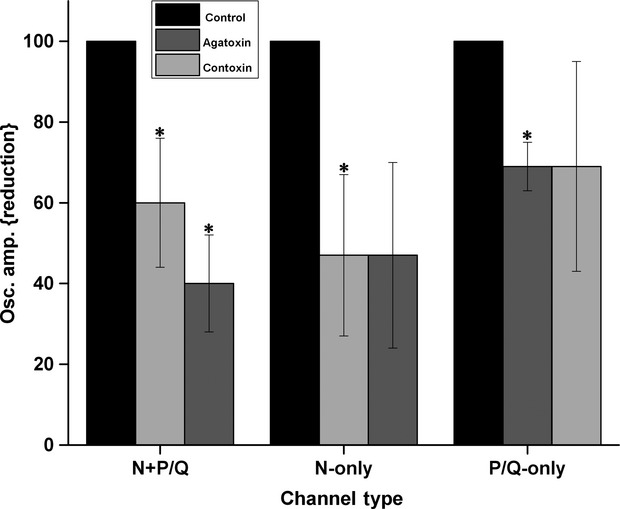
Reduction by toxins on the mean peak oscillation amplitude of each channel type. The bar graph shows the mean and standard error of the peak oscillation amplitude of cells within each channel type (left, N+P/Q n = 15; middle, N only n = 9; right, P/Q only n = 6) calculated by measuring the three highest amplitude oscillations after filtering to derive mean amplitude. Light Gray bars indicate the percentage of reduction caused by the addition of ω-CgTx. Dark gray bars indicate the percentage of reduction caused by the addition of ω-Aga. On the left, N+P/Q cells, there was a significant reduction in amplitude after ω-Aga, and an additional significant reduction after ω-CgTx. In the middle, N only cells showed a significant reduction after ω-CgTx, but no further reduction after ω-Aga. On the right, P/Q only cells showed a significant reduction after ω-Aga, but no further reduction after ω-CgTx, *P < 0.05.