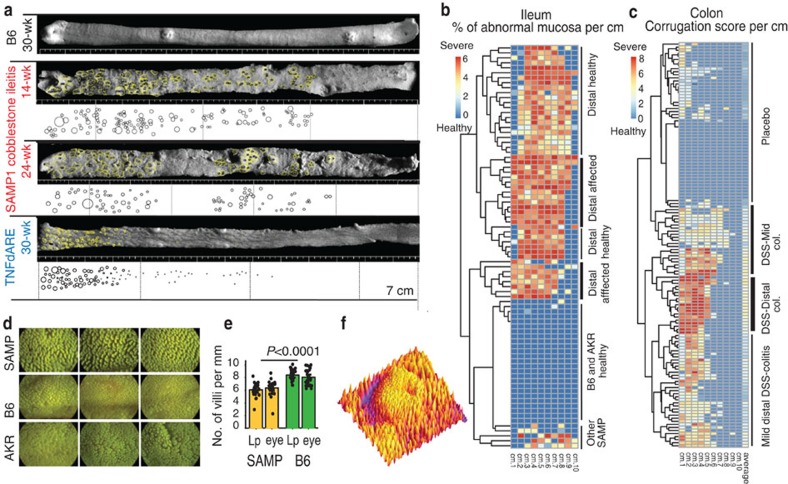
Figure 4. Data derived from 3D-SAMPgut is suitable for spatial visualization and ImageJ software analysis.
Ileo-cecal junction to the left, light from the right. (a) Bubble plot analysis of ‘cobblestone areas' in SAMP mice contrast the marked proximad gradient of ‘villous-fusion' pattern observed in TNFARE ileitis (Supplementary Fig. 13). Note the skip/healthy area in 24-week (wk) SAMP mouse. (b) Hierarchical cluster (unsupervised, Euclidean) analysis of SM % abnormal areas, cm by cm, in the last 10 cm of small intestine (ileum of SAMP and control mice, n=135), or (c) colon (various strains with and without DSS treatment, n=214). Log2 transformed data. Note regional patterns of intestinal inflammation, and bimodal distribution of lesions in the last cm of small intestine (cm1) at the population level, and the presence of mouse subpopulations that are more affected in the mid-colon, while others are affected distally. With the exception of mdr1a−/− adult mice (Table 1), which had pan-colitis, proximal colitis was infrequent. Heat maps, built using public-domain scripts in R (www.r-project.org/), are amenable to larger data sets (d) In addition to the analysis of abnormal areas, SM images also allowed the rapid analysis of intestinal villi in remaining seemingly ‘normal/unaffected' areas. (e) For villous count analysis, ImageJ line plots (Lp) facilitated the enumeration of villi, which was similar to counting villi by eye (n=30 per strain, t-test P>0.2). (f) 3D visualization of the mucosal surface of an ileal cobblestone structure interpreted with ImageJ.

