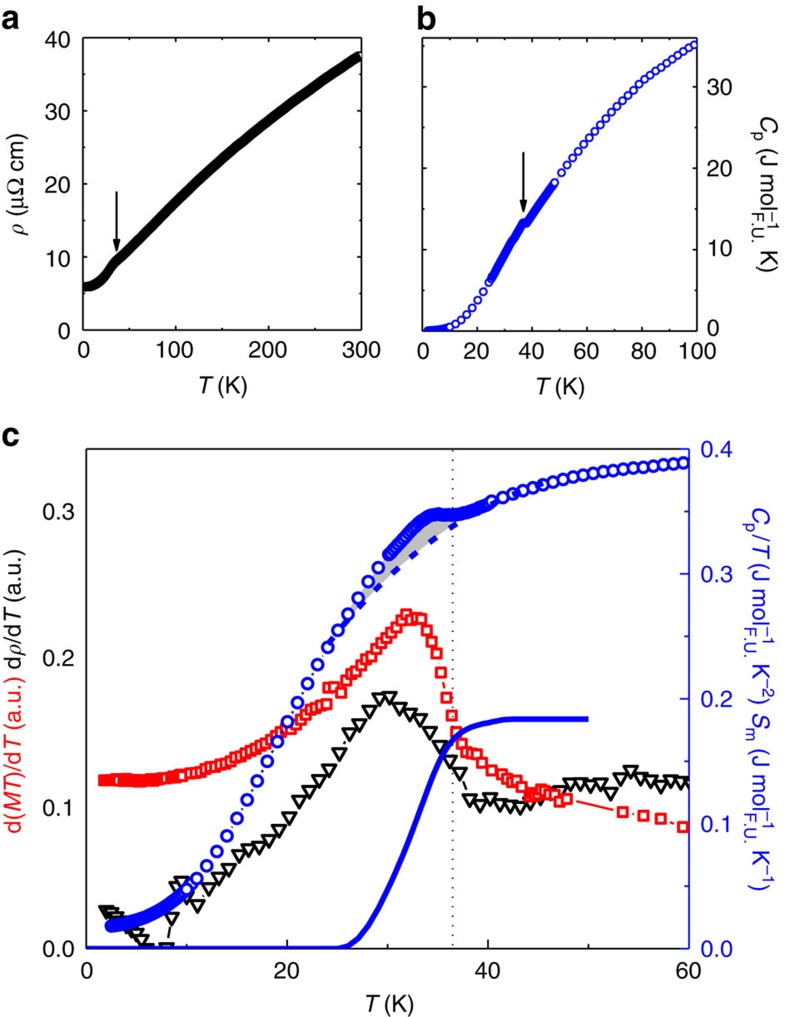
Figure 2. Specific heat and resistivity of TiAu.
H=0 temperature-dependent resistivity (a) and specific heat (b) with black arrows indicating the feature corresponding to TN. (c) The ordering temperature TN (vertical dotted line) for TiAu determined from peaks in the temperature derivatives of resistivity, dρ/dT (H=0, black triangles, left axis), and d(MT)/dT (μ0H=0.1 T, red squares, left axis), and in Cp/T (H=0, blue circles, right axis). The entropy Sm (solid blue line, right axis) is calculated by subtracting a polynomial non-magnetic component (dashed blue line) from the measured specific heat data (blue circles).

