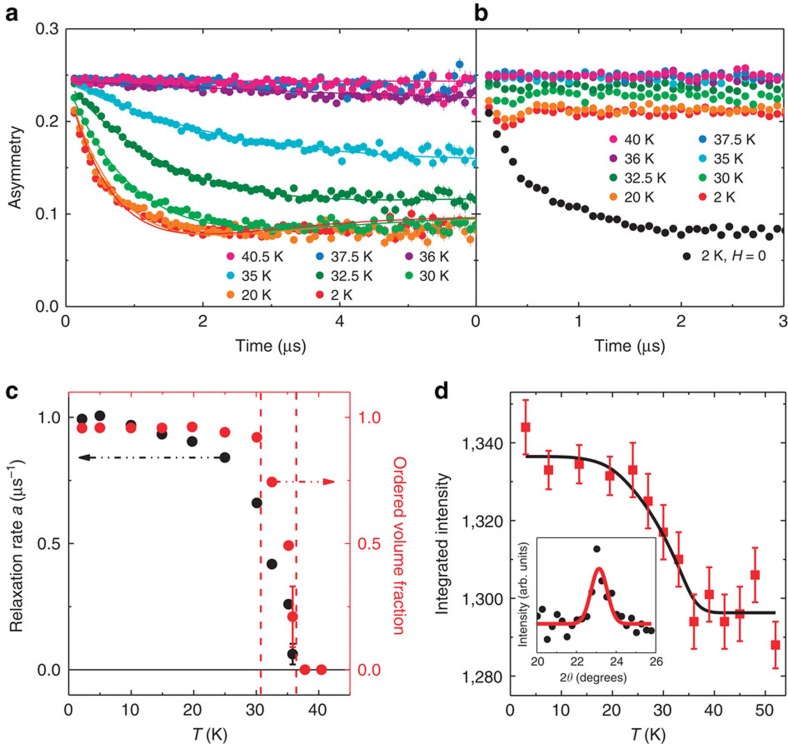
Figure 4. Muon spin relaxation and neutron diffraction.
(a) Time dependence of the asymmetry in H=0, fit with equation (1) (solid lines). (b) A small applied longitudinal field μ0H=0.01 T eliminates the relaxation response. For comparison, the H=0 T=2 K asymmetry is shown in black circles. (c) Relaxation rate a (black circles, left) and volume fraction (red circles, right) as a function temperature (H=0). (d) Integrated intensity of the (0, π/b, 0) TiAu magnetic Bragg peak as a function of temperature with mean-field fit (TN=36±2 K, black curve). Inset: net counts normalized for 2 min. counting time between 2.5 and 60 K, showing the (0, π/b, 0) magnetic peak fit with a resolution-limited Gaussian (red line). Uncertainties are statistical in origin and represent one standard deviation.

