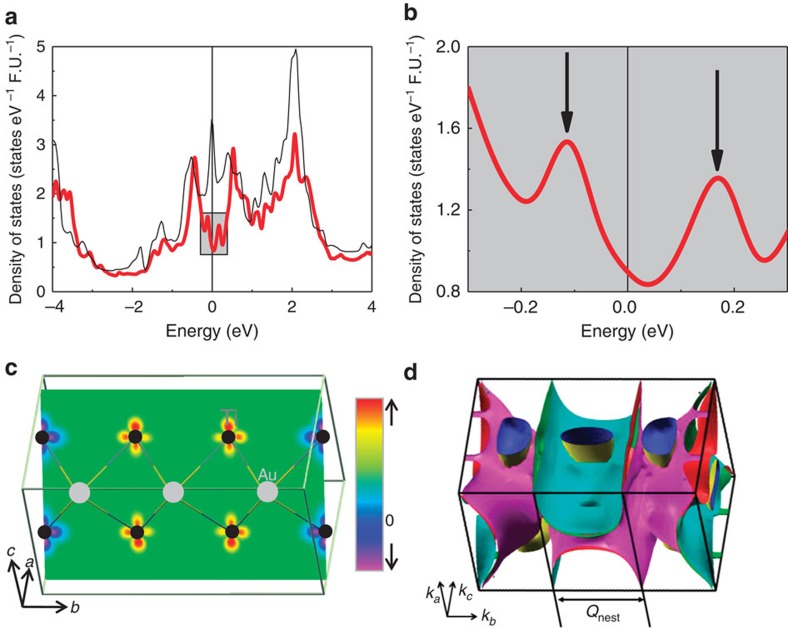
Figure 5. Band structure calculations for TiAu.
(a) The non-magnetic density of states (thin black line) exhibits a peak close to the Fermi surface, similar to that seen in other itinerant magnets. (b) For the AFM1 ground state, the finite total density of states (thick red line) at the Fermi energy is flanked by two peaks around 0.1 eV, which explains the metamagnetic transition at low T (see text). (c) The electron spin density shows a modulation along the b axis, consistent with the k=2π/3b nesting shown in d. The colour scale indicates degree of electron polarization, ranging from spin-up (red) to spin-down (purple). The arrows identify the crystallographic directions, marked by a, b and c axes. Fermi surface with nesting vector Qcalc=(0,2π/3b,0) is shown in d. The Fermi surface is coloured for ease of viewing. The arrows identify the wavevectors in the reciprocal space, marked by ka, kb and kc.

