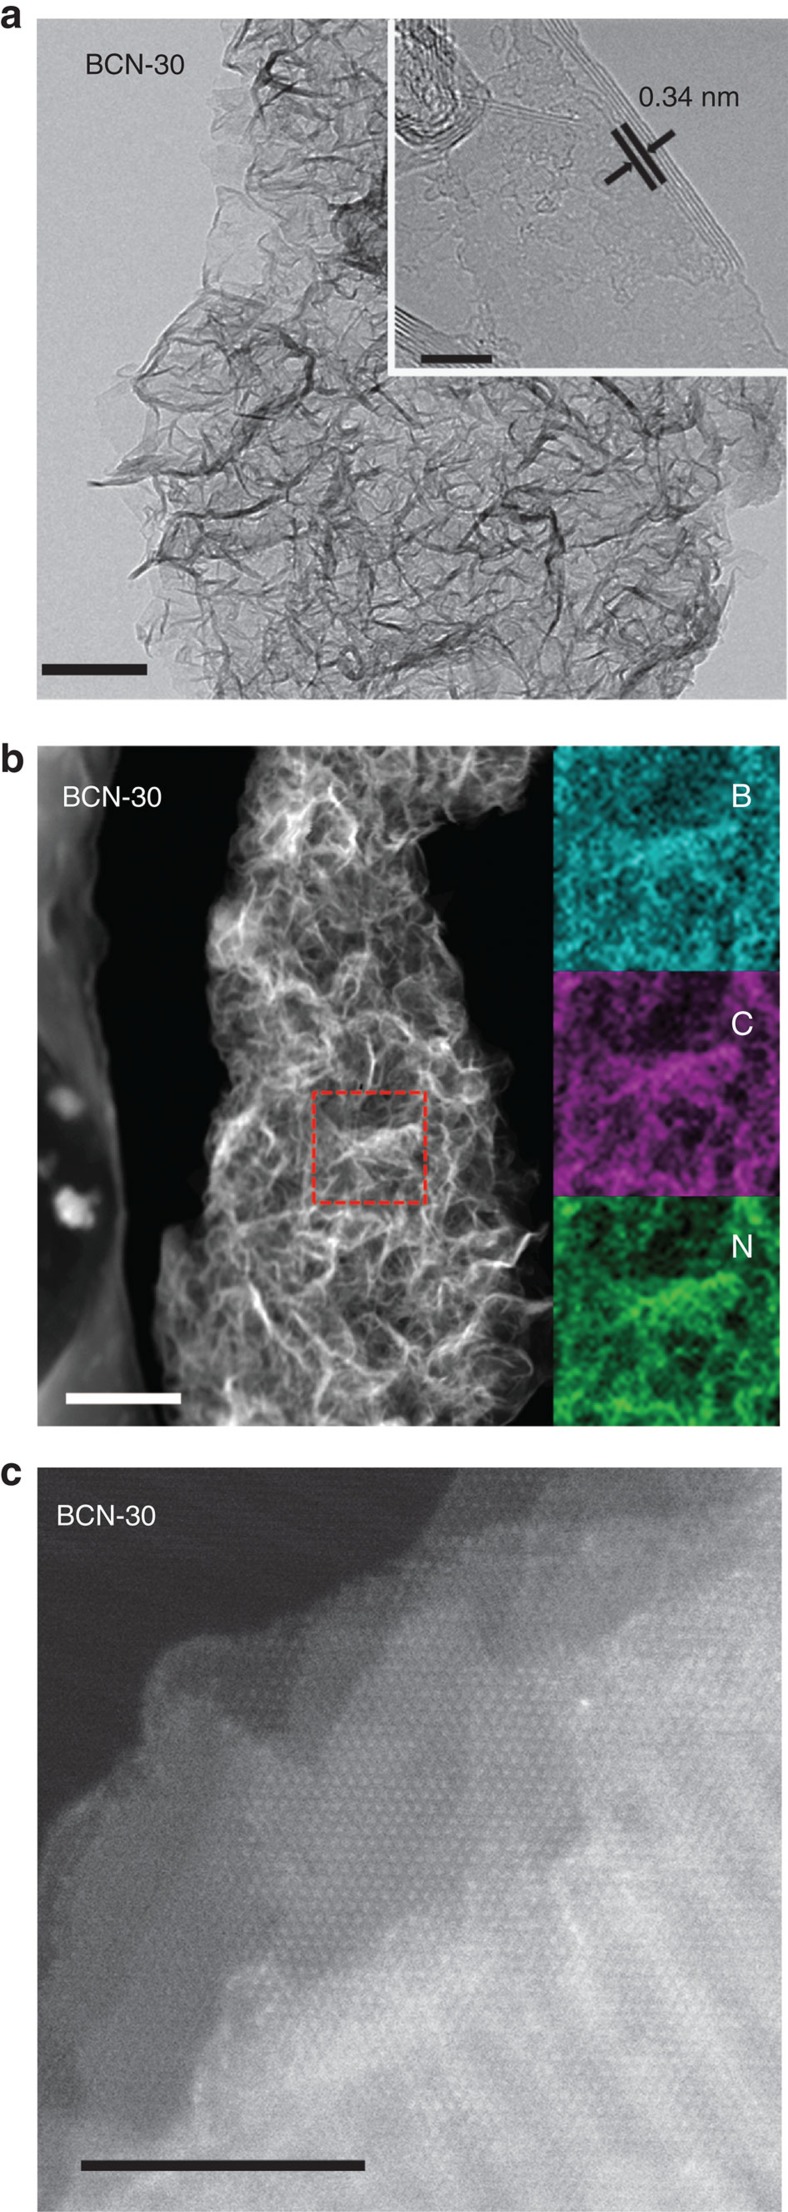
Figure 3. Surface morphology of BCN-30.
(a) HRTEM image of the BCN-30 sample. Scale bar, 100 nm, inset scale bars, 5 nm. (b) Typical TEM dark-field image of BCN-30 sample and the elemental mapping images of B, C and N of the enlargement of selected-area in the picture. Scale bar, 300 nm. (c) High-resolution STEM of the BCN-30 sample along (002) facet. Scale bar, 5 nm.

