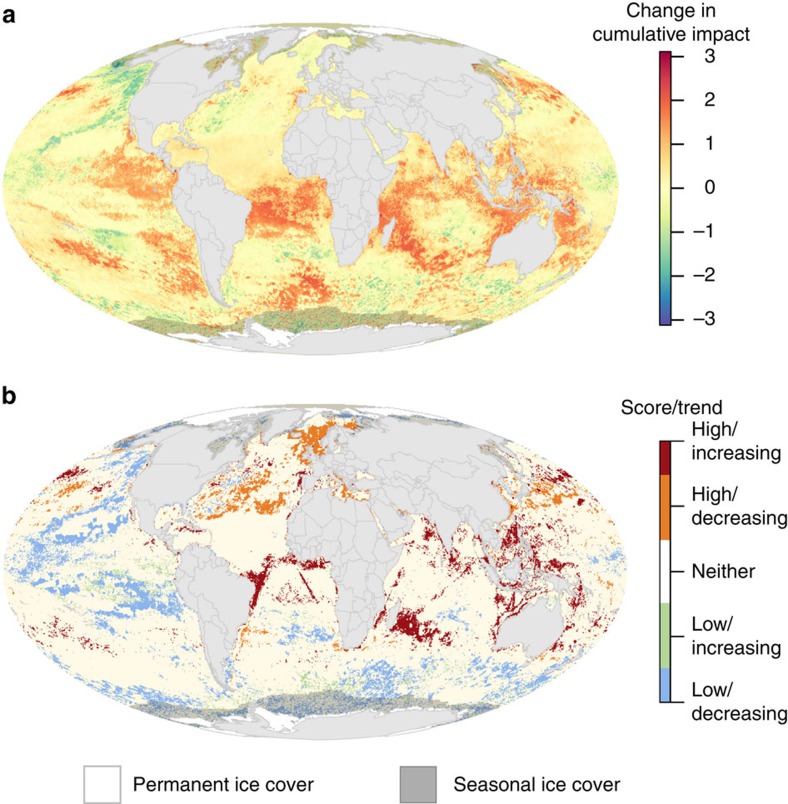
Figure 1. Change in cumulative human impact to marine ecosystems.
(a) Absolute difference between current (as of 2013) and earlier (as of 2008) per-pixel cumulative impact scores based on 12 anthropogenic stressors that could be compared across time (max cumulative impact score for both periods=11.1). Positive scores represent an increase in cumulative impact. (b) Extreme combinations of cumulative impact and impact trend include areas with combinations of the highest (top quartile) and lowest (bottom quartile) impact and increasing (top quartile) and decreasing (bottom quartile) impact. In both panels, areas of permanent sea ice are shaded white and the area within maximum sea ice extent is shaded to indicate where scores are less certain because change in sea ice extent could not be included (see Supplementary Methods).

