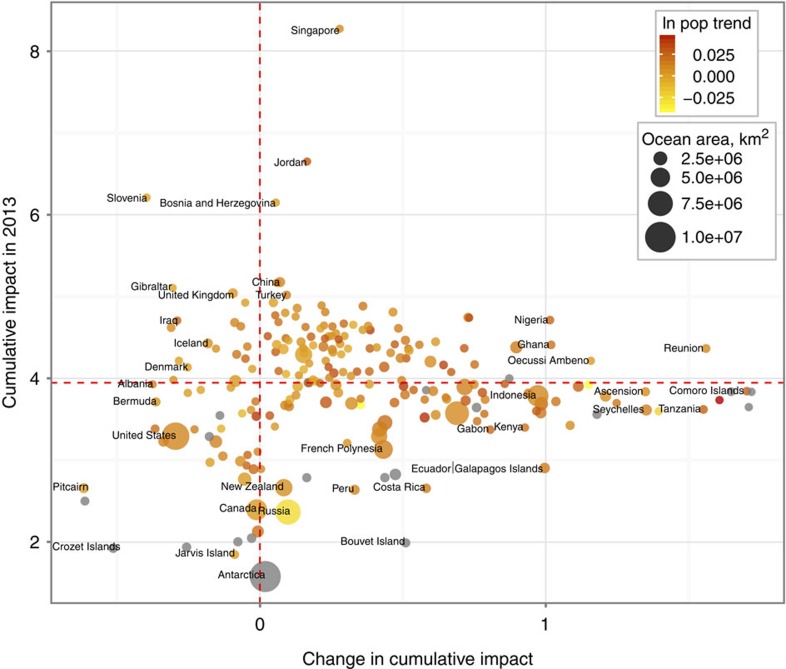
Figure 2. Current cumulative impact versus change in impact.
The relationship between current cumulative impact (as of 2013) and 5-year change in impact from 5 years before for each country's EEZ (200 nm) is shown based on the 12 common stressors. Bubbles are scaled to the area (ln) of each country's EEZ and colour-coded by the change in the log of coastal population (25 miles inland) per year from 2008 to 2013; a subset of countries is labelled. Grey bubbles are nearly uninhabited. Horizontal dashed red line is the global median cumulative impact score in 2013; vertical line is no change over time. See Supplementary Tables 1 and 2 for data for all countries.

