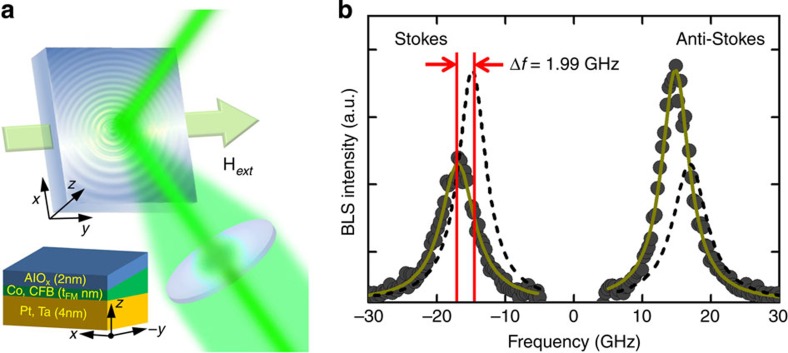
Figure 1. The BLS measurements.
(a) Schematic configuration of the BLS measurement. The external magnetic field is applied along the y-direction and a p-polarized laser beam excites two interfaces SWs along the x-direction. Inset: schematic picture of wedge-type sample geometry. (b) The BLS spectrum with a magnetic field Hext=0.69 T. The incident angle is fixed at θ=45° (kx=0.0167, nm−1). To identify the frequency differences (Δf) between Stokes (negative frequency region) and anti-Stokes (positive frequency region), mirrored curves are drawn as black dashed line. The red vertical lines indicate the centre of the SW frequency and red arrows indicate the Δf, here 1.99 GHz. The black circles refer to the experimental result and dark yellow solid line is the Lorentzian fitting curve. The data accumulation time for each spectrum is about 60 min.

