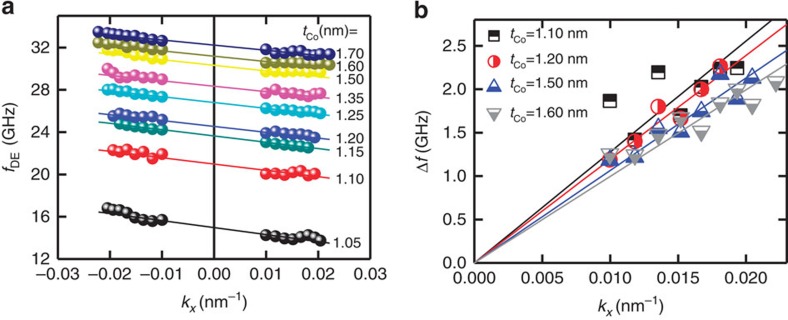
Figure 4. The SW dispersion relation and the linearity of the Δf in each thickness.
(a) The asymmetric dispersion relation measured by the BLS for various Co thicknesses. For these measurements, the applied magnetic field is fixed at Hext=0.915 T. The solid lines correspond to linear fit to the experimental results. For all Co thicknesses, the fDE linearly decreases with increasing kx. These asymmetric and linear dispersion relations can be regarded as the direct evidence that the Δf in our measurement is a consequence of IDM interaction. (b) All Δf and linear fitting lines are visualized in one graph.

