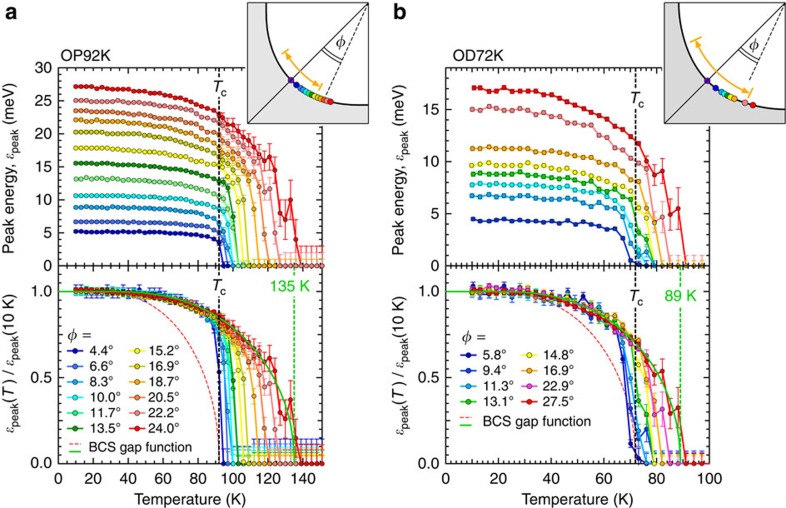
Figure 2. Disagreement between the ARPES results and the conventional BCS gap function.
(a,b) Temperature dependence of spectral peak energy, ɛpeak(T), at various kF points (colour circles in the insets) for OP92K and OD72K, respectively. In the bottom of each panel, the same curves of ɛpeak(T) are normalized to the maximum value at the lowest temperature. A red dashed curve and a green solid curve are the BCS gap function with the onset at Tc and Tpair, respectively (Tpair=135 K for OP92K and Tpair=89 K for OD89K). The inset shows the Fermi surface with measured kF points (colour circles). The bold orange line indicates the momentum region where the Fermi arc was previously claimed to emerge at Tc. Error bars in a and b represent standard deviations of the spectral peak positions.

