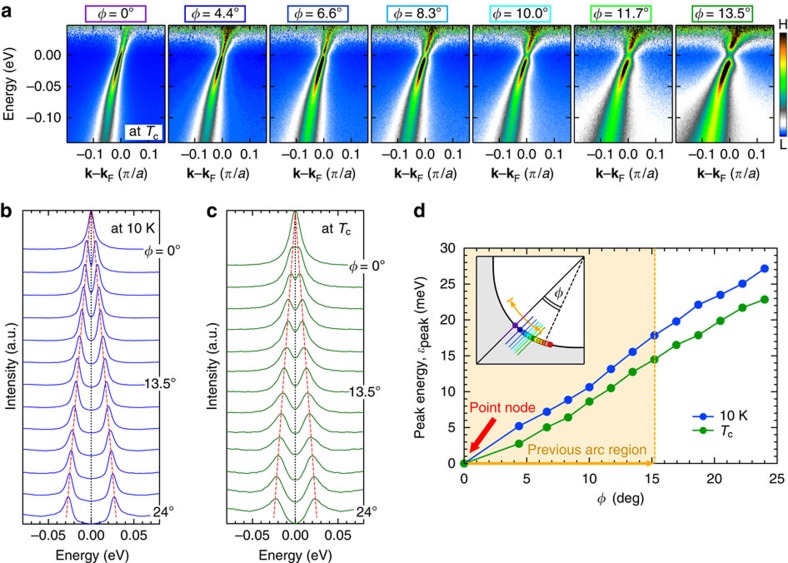
Figure 3. Momentum variation of spectra showing the absence of Fermi arc at Tc.
(a) Dispersion maps at Tc along several momentum cuts (colour lines in the inset of d measured for OP92K. Each map is divided by the Fermi function at the measured temperature. The described φ are the directions of measured kF points (φ is defined in the inset of d). (b,c) Symmetrized EDCs at kF over a wide range of angle φ (colour circles in the inset of d) at 10 K and Tc (=92 K), respectively. The red dotted lines are guide to the eyes for the gap evolution. (d) Fermi angle φ dependence of peak energies of spectra in b (ɛpeak(10 K)) and c (ɛpeak(Tc)). The orange arrows indicate the momentum region where the Fermi arc was previously claimed to emerge at Tc.

