Figure 3.

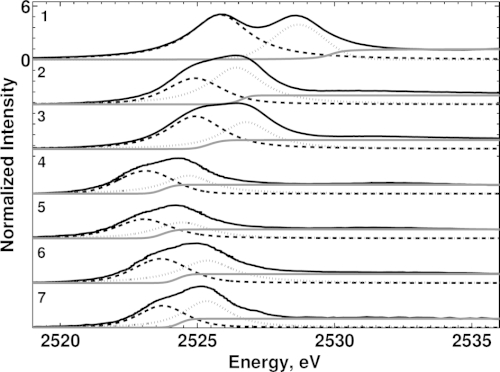
Normalized Mo L3-edge XAS data for compounds 1–7, reflecting the differences in edge position, pre-edge intensity ratios and ligand field splittings, as obtained from the fits (see Table1).

Normalized Mo L3-edge XAS data for compounds 1–7, reflecting the differences in edge position, pre-edge intensity ratios and ligand field splittings, as obtained from the fits (see Table1).