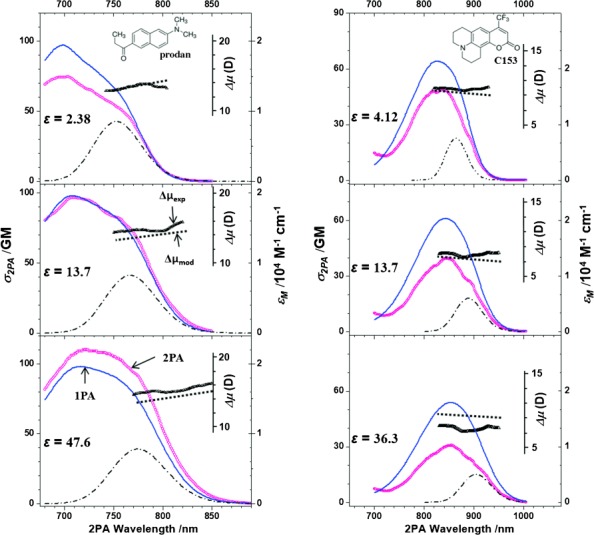
Figure 1.

1PA spectrum (blue line) and 2PA spectrum (pink symbols) in prodan (left) and C153 (right), each in three representative toluene:DMSO mixtures. Gaussian fit to the lowest energy band of the S0→S1 transition (dash-dotted line); measured Δμ dependence (black symbols, inserted vertical scale); predicted Δμ dependence (thick dotted line).
