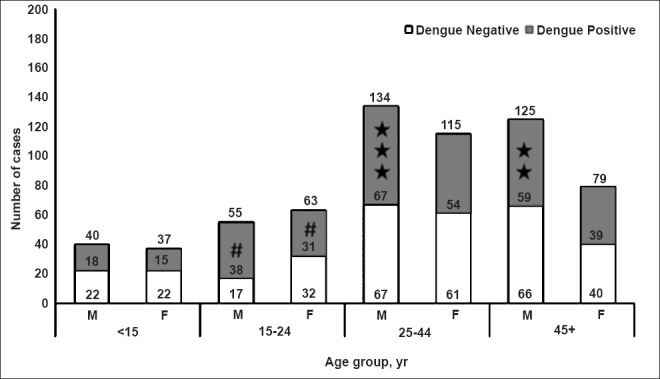
Fig. 1.

Age, sex distribution of the suspected and confirmed dengue cases from Mandla district (X axis, age groups in years, M= males; F, females. The number in and on the top of bars indicate total cases, Y axis, number of cases; #, the most affected group [OR= 1.90 (95%CI = 1.06-3.4) P=0.03];★, death cases.
