Fig. 2.

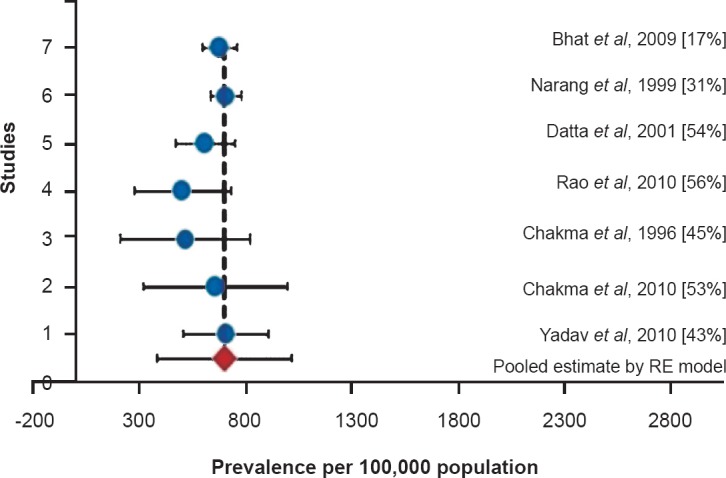
Sensitivity analysis showing the changes in pooled estimate along with the hetetogeneity measure when that study is removed. Percentage given in parentheses are I2 values.

Sensitivity analysis showing the changes in pooled estimate along with the hetetogeneity measure when that study is removed. Percentage given in parentheses are I2 values.