
Fig. 1.
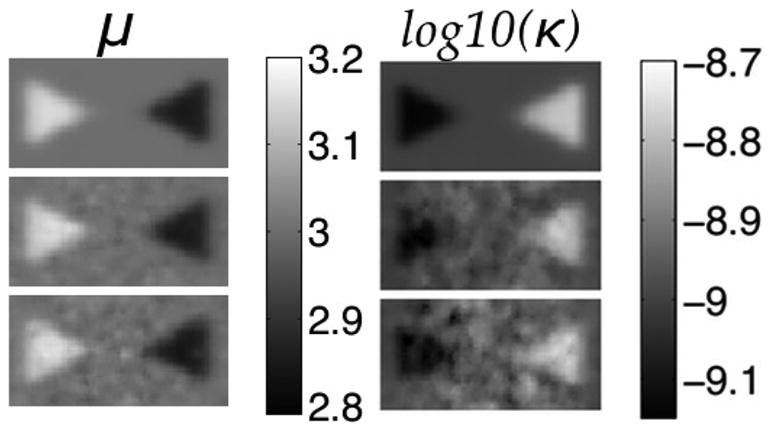
Shear modulus (left) and hydraulic conductivity (right) elastograms of a simulated phantom with two conical inclusions. Rows correspond to no displacement noise (Row 1), 1.5% noise (Row 2), and 3% noise (Row 3). True property values: background-μ = 3 kPa and κ = 1 × 10⁻⁹(m3s/kg), left cone-μ = 3.2 kPa and 9 × 10⁻¹⁰(m3s/kg), right cone-μ = 2.8 kPa and κ = 2 × 10⁻⁹(m3s/kg). Shear modulus is given in kPa and hydraulic conductivity in log10(m3s/kg).