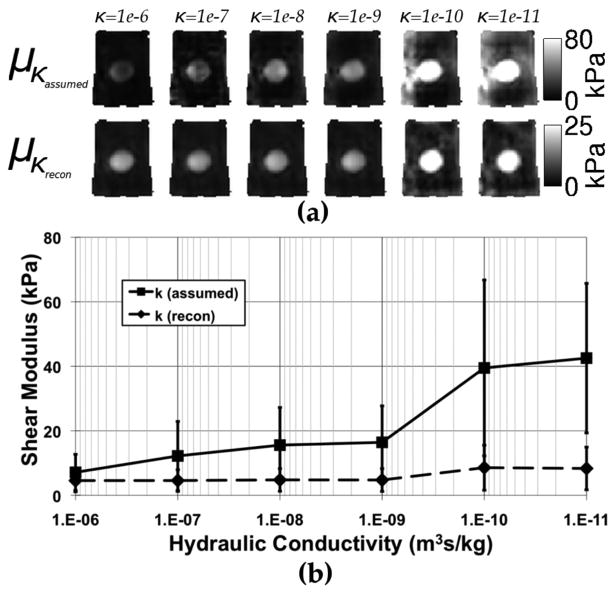
Fig. 3.
Shear modulus elastograms for the homogeneous (a, top row—κ-value indicated above elastogram) and spatially-varying (a, bottom row) models of hydraulic conductivity. The average shear modulus estimated for the entire phantom is shown for each case in (b). Error bars represent the standard deviation over the whole phantom.

