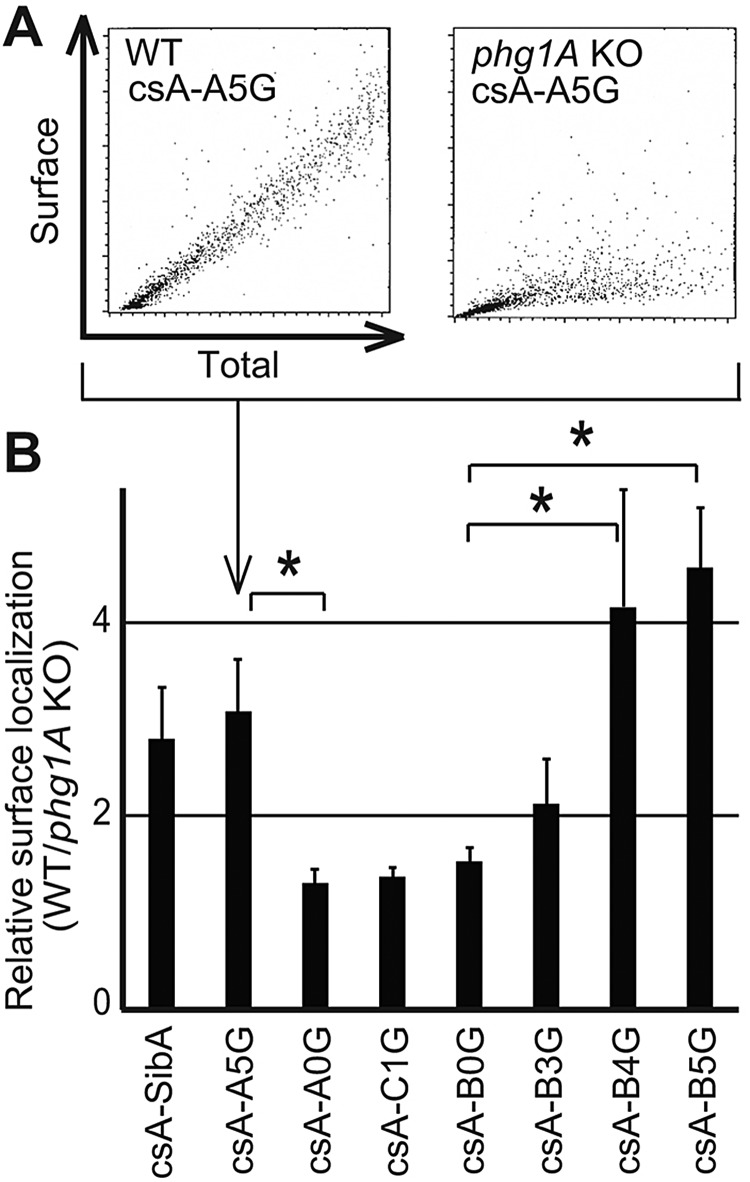
Fig. 2.
Efficient surface targeting of glycine-rich TMDs by Phg1A. (A) Analysis of total expression and cell surface levels of csA-A5G chimeras in WT (left panel) and phg1A KO Dictyostelium cells (right panel) by flow cytometry. For each cell, the total and the surface levels of csA fusion protein were determined. In order to extrapolate a numeric value from the dot plot analysis, a linear regression was used. (B) We calculated the surface targeting (in arbitrary units) by dividing the slope obtained in A for WT cells and for phg1A KO cells. The mean±s.e.m. of at least eight experiments are indicated. *P<0.01 (Student's t-test).

