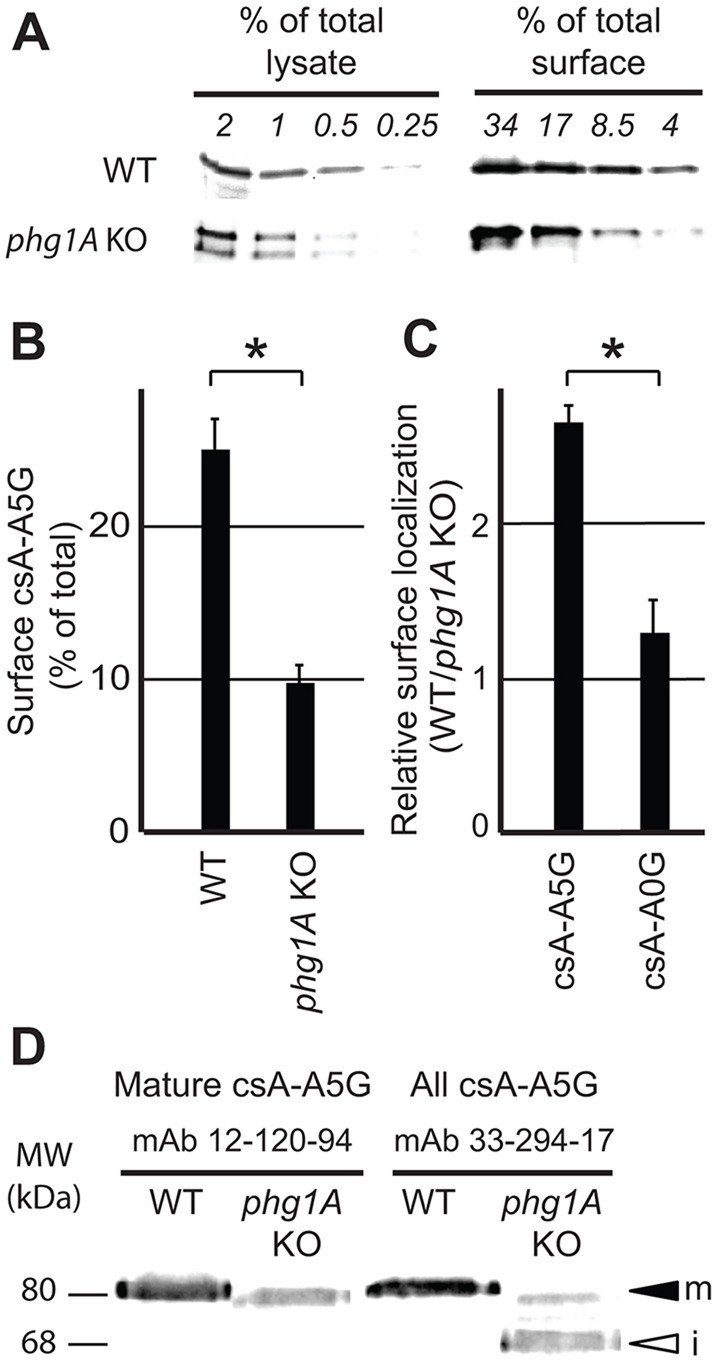
Fig. 3.

Biochemical analysis confirms differential surface localization of glycine-rich TMDs in WT versus phg1A KO cells. (A) Following cell surface biotinylation, surface csA-A5G fusion protein was purified on neutravidin beads, and its level compared to the total cellular level by western blotting after serial dilution. The percentage of total or surface proteins loaded on each lane is indicated. Based on these results, the percentage of csA-A5G fusion protein present at the cell surface was determined in WT (20.5% of total) and phg1A KO cells (7% of total) (see supplementary material Fig. S1A for details of the quantification). (B) The mean±s.e.m. of three independent experiments as described in A was determined. CsA-A5G was significantly more abundant at the surface of WT cells than at the surface of phg1A KO cells. (C) Relative targeting of each fusion protein in WT versus phg1A KO cells was obtained by dividing the percentage of surface csA in WT cells by that in phg1A KO cells (e.g. 20.5/7.0 in A). The mean±s.e.m. of at least three independent experiments are indicated. Cell surface localization of csA-A5G, but not of csA-A0G, was decreased in phg1A KO cells relative to WT cells. *P<0.01 (Student's t-test). (D) Export of csA-A5G out of the ER is affected in phg1A KO cells. Cellular lysates of WT or phg1A KO Dictyostelium cells were analyzed by western blotting using antibody 12-120-94, which detects only mature csA, and antibody 33-294-17, which detects both mature and immature csA. The mature csA-A5G (m) exhibited a molecular mass of 80 kDa, whereas the low-molecular-mass form (68 kDa) detected in phg1A KO cells corresponded to the immature ER form (i).
