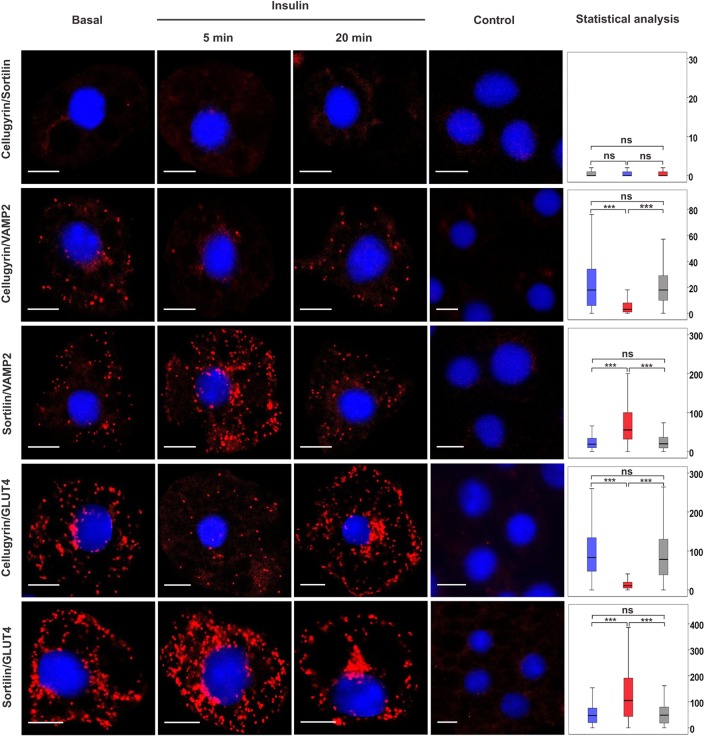
Fig. 1.
Pairwise associations between cellugyrin, sortilin and VAMP2 or GLUT4 in the presence and absence of insulin stimulation. A PLA was used to detect pairwise associations between cellugyrin or sortilin and VAMP2 or GLUT4 in 3T3-L1 adipocytes treated or not (Basal) with 100 nM insulin for 5 or 20 min as indicated (Insulin). PLA signals are shown in red; DAPI stain is in blue. Controls omitting the first listed primary antibody are shown (controls omitting either and both primary antibodies were performed in parallel with no significant signal detected). Statistical analyses of PLA data were performed using Blobfinder and SPSS software. The boxplots show the median number of signals and interquartile range of 200–300 cells per condition (y-axis: blue, basal; red, 5 min insulin stimulation; grey, 20 min insulin stimulation); the upper and the lower whiskers show the 25th and the 75th percentiles, respectively. Images are representative of three independent experiments. For all control experiments, the median PLA signal value was <1 per cell. Any median signal >1 obtained in the presence of both primary antibodies was found to be significantly greater than that obtained in controls for all combinations shown. ns, P≥0.05, ***P<0.001. Scale bars: 10 μm.

