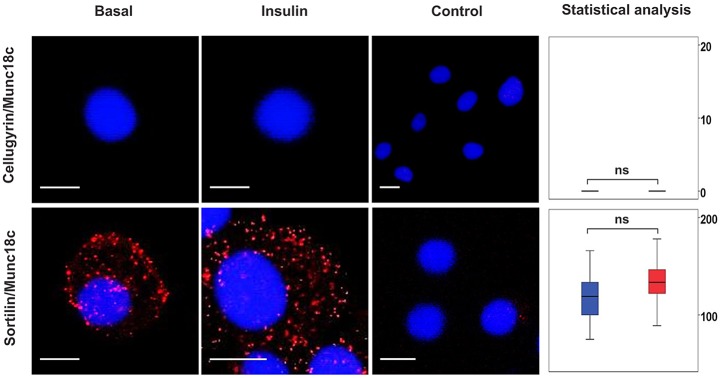
Fig. 3.

Pairwise associations between cellugyrin, sortilin and Munc18c in the presence and absence of insulin stimulation. A PLA was used to detect pairwise associations between cellugyrin, sortilin and Munc18c in 3T3-L1 adipocytes treated or not (Basal) with 100 nM insulin for 5 min (Insulin). PLA signals are shown in red; DAPI stain in is blue. Data were analysed and represented as for Fig. 1 (y-axis: blue, basal; red, 5 min and grey, 20 min insulin stimulation respectively). ns, P≥0.05. Scale bars: 10 μm.
