Fig. 1.
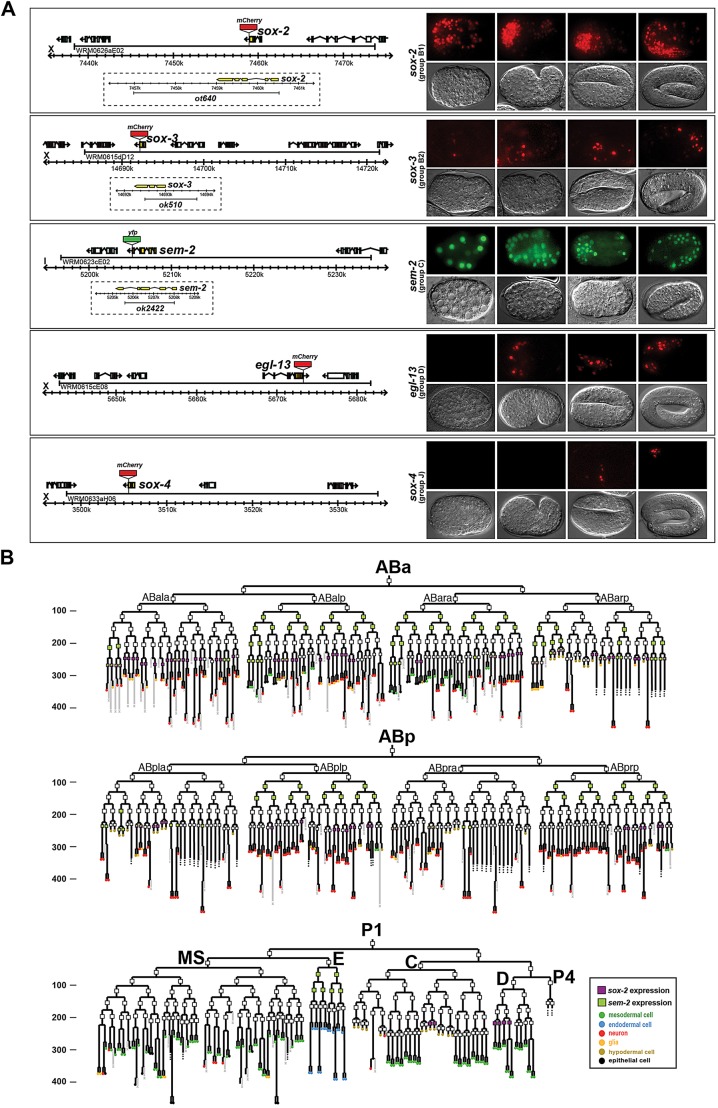
C. elegans Sox gene expression. (A) Representative images of Sox gene expression (top rows; bottom rows are DIC images) at different stages of embryonic development (right), together with fosmid reporter schematics (left). (B) Lineage diagram showing the specific cells in which sox-2 and sem-2 are expressed during embryogenesis, as determined by a combination of manual and automated lineaging using 4D microscopy and the SIMI software or the StarryNite and AceTree software, respectively. Rectangles indicate the stage at which expression was examined; a filled rectangle indicates expression, whereas no fill indicates no expression. Expression in the last cell division of the lineage is not represented in this diagram. Numbers on the y-axis represent developmental time (in minutes). N=2. See Table 2 for a summary of expression in postembryonic neuron types.

